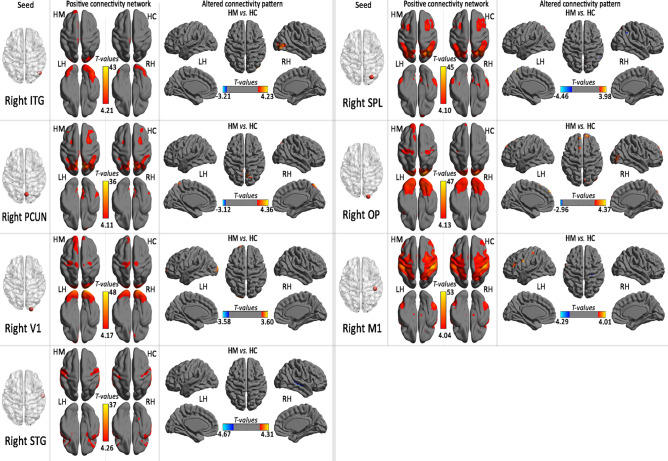
Figure 4.
Positive connectivity network and group comparison in the region of interest in right hemisphere (seed) with altered regional cortical thickness in HM subjects (LH light hemisphere, RH right hemisphere, HM high myopic control, HC healthy control, ITG inferior temporal gyrus, V1 primary visual area 1, STG right superior temporal gyrus, SPL right superior parietal lobule, M1 right the primary motor cortex, OP parietal operculum, PCUN precuneus).

