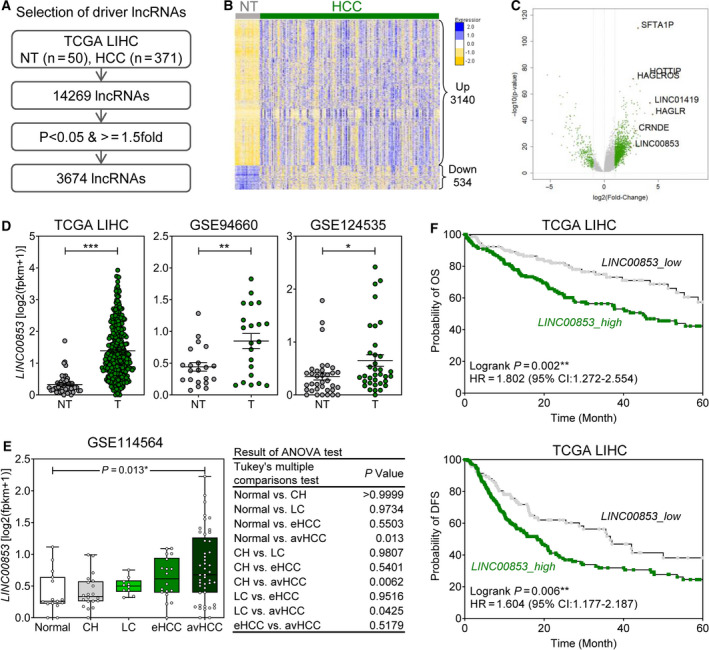
Fig. 1.

Correlation between clinical findings and LINC00853 overexpression in HCC cohorts. (A) The strategy to identify novel lncRNA markers for HCC. (B) Heatmap of 3674 HCC‐associated lncRNA signatures in the TCGA_LIHC dataset. (C) Volcano plot representation of differentially expressed lncRNA signatures in the nontumor and the HCC cohorts. (D) LINC00853 expression in the nontumor and the HCC cohorts in three HCC RNA‐Seq datasets (TCGA_LIHC, GSE94660, and GSE124535). Welch's t‐test; *P < 0.05, **P < 0.01, ***P < 0.001. (E) Changes in expression of 10 candidate marker genes in patients with different types and severity of liver disease in GSE114564 dataset. Statistically significant differences were determined using one‐way ANOVA with Tukey's multiple comparisons test. (F) The Kaplan–Meier survival curves for overall survival (left) and disease‐free survival (right) based on LINC00853 expression in patients with HCC in TCGA_LIHC dataset.
