Fig. 2.

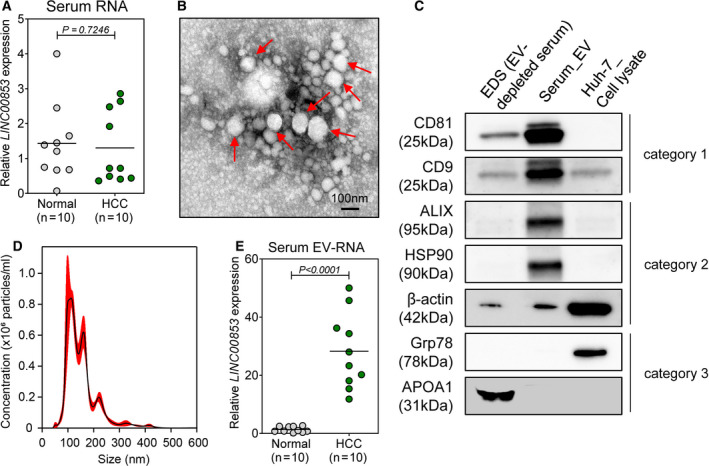
Expression of LINC00853 in patient serum samples and serum‐derived EVs. (A) Scatter plot of LINC00853 expression in the sera of healthy subjects (n = 10) and patients with HCC (n = 10). Statistically significant differences were determined using Welch's t‐test. Black horizontal lines denote means. (B) TEM image showing the spherical morphology of the isolated small EVs (diameter = ~ 100 nm), bar = 100 nm. (C) Representative immunoblots showing the expression of EV markers in the isolated EVs, according to MISEV 2018 guidelines. EDS and Huh‐7 cell lysate were used as controls. (D) The concentration and size distribution of EVs in the serum of a patient with HCC, as determined by NTA. (E) Scatter plot of LINC00853 expression in serum‐derived EVs of healthy subjects (n = 10) and patients with HCC (n = 10). Statistically significant differences were determined using Welch's t‐test. Black horizontal lines denote sample means. Target gene expression was calculated relative to that of HMBS.
