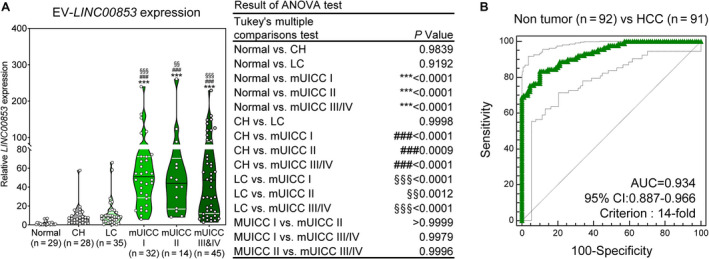
Fig. 3.

Expression of EV‐LINC00853 and its diagnostic performance in the validation cohort. (A) Violin plot of EV‐LINC00853 expression, as measured by RT–qPCR. Statistically significant differences were determined using the one‐way ANOVA with Tukey's multiple comparisons test. Black horizontal lines denote means, and error bars represent SEM. Compared to healthy liver; *P < 0.05, **P < 0.01, ***P < 0.001, compared to CH; #P < 0.05, ##P < 0.01, ###P < 0.001, compared to LC; §P < 0.05, §§P < 0.01, §§§P < 0.001. (B) Analysis of EV‐LINC00853 ROC curve in patients with HCC vs control (healthy, CH, and LC). Statistically significant differences in the AUC were relative to AUC of 0.5. Target gene expression was calculated relative to that of HMBS.
