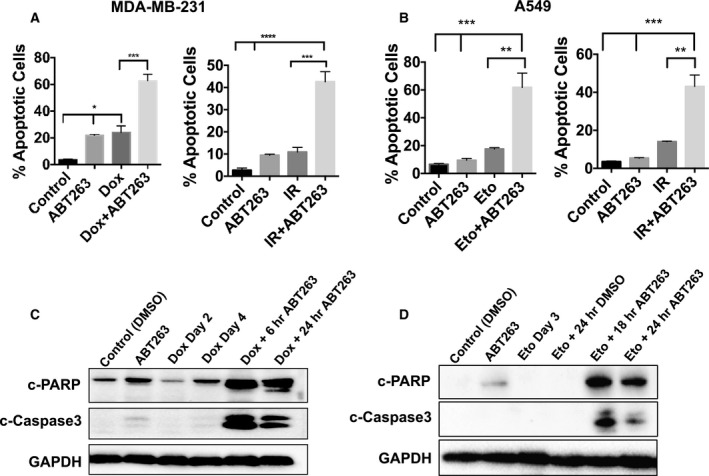
Fig. 3.

ABT‐263 induces apoptotic cell death in senescent cells. (A, B) Annexin‐V/PI quantification of apoptosis induced by 2 µm ABT‐263 with overnight exposure in MDA‐MB‐231 (A) or A549 (B) cells after treatment with Dox/Eto (left panels) or IR (right panels). *P ≤ 0.05, **P ≤ 0.01, ***P ≤ 0.001, and ****P ≤ 0.0001 indicate statistical significance comparing the bracketed conditions as determined using one‐way ANOVA with Tukey's post hoc test. (C, D) Western blotting for cleaved PARP and cleaved caspase‐3 in MDA‐MB‐231 (C) and A549 (D) cells for the indicated treatments and time points. All images are representative fields or blots from three independent experiments (n = 3), and all quantitative graphs are mean ± SEM from three independent experiments (n = 3).
