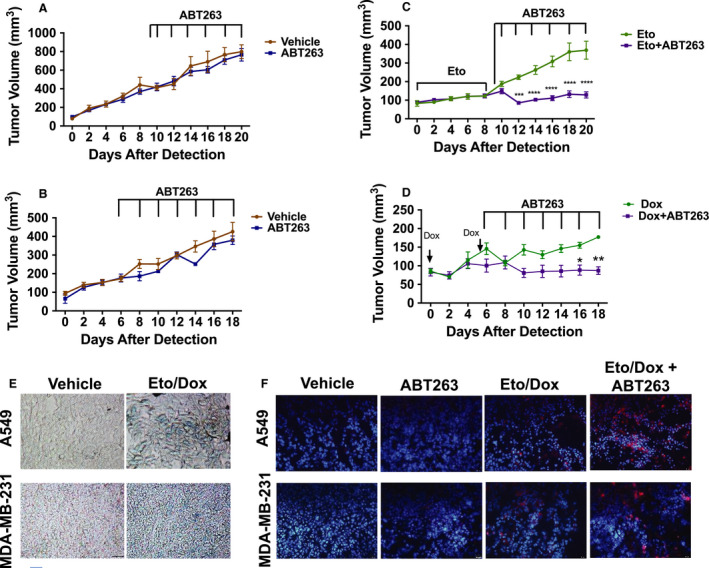
Fig. 4.

Sequential administration of ABT‐263 following chemotherapy confers decreased tumor burden in vivo. (A, B) Tumor volume over time in A549 (A) and MDA‐MB‐231 (B) tumor‐bearing mice that received either vehicle or ABT‐263 (50 mg·kg−1) only. (C, D) Tumor volume over time in A549 (C) and MDA‐MB‐231 (D) tumor‐bearing mice that received either chemotherapy (15 mg·kg−1 Eto or 2.5 mg·kg−1 Dox) only or chemotherapy followed by ABT‐263 (50 mg·kg−1). ***P ≤ 0.001 and ****P ≤ 0.0001 indicate statistical significance of tumor volumes of mice treated with Eto alone vs. tumor volumes of mice treated with Eto + ABT263 (C) as determined using two‐way ANOVA with Sidak's post hoc test, while *P ≤ 0.05 and **P ≤ 0.01 indicate statistical significance of tumor volumes of mice treated with Dox alone vs. tumor volumes of mice treated with Dox + ABT263 (D) as determined using two‐way ANOVA with Sidak post hoc test. (E) X‐Gal staining of tumor slices from mice in the indicated groups. All bright‐field images were captured at the same magnification (objective 20×). (F) Immunofluorescence for cleaved caspase‐3 and DAPI in tumor slices from mice in the indicated groups. Blue fluorescence indicates nuclear staining with DAPI, and red fluorescence reflects caspase 3 immunostaining. All fluorescent images were captured at the same magnification (objective 20×). A549 tumor volumes, n = 4 for vehicle, n = 8 for ABT‐263, n = 9 for Eto, and n = 14 for Eto + ABT‐263. For MDA‐MB‐231 tumor volumes, n = 4 for vehicle, n = 4 for ABT‐263, n = 5 for Dox, and n = 6 for Dox + ABT‐263 (n denotes number of mice harboring bilateral tumors). Graphs are represented as mean ± SEM. All tumor images are representative fields from four tumor slices (n = 4) taken from two mice per group (n = 2).
