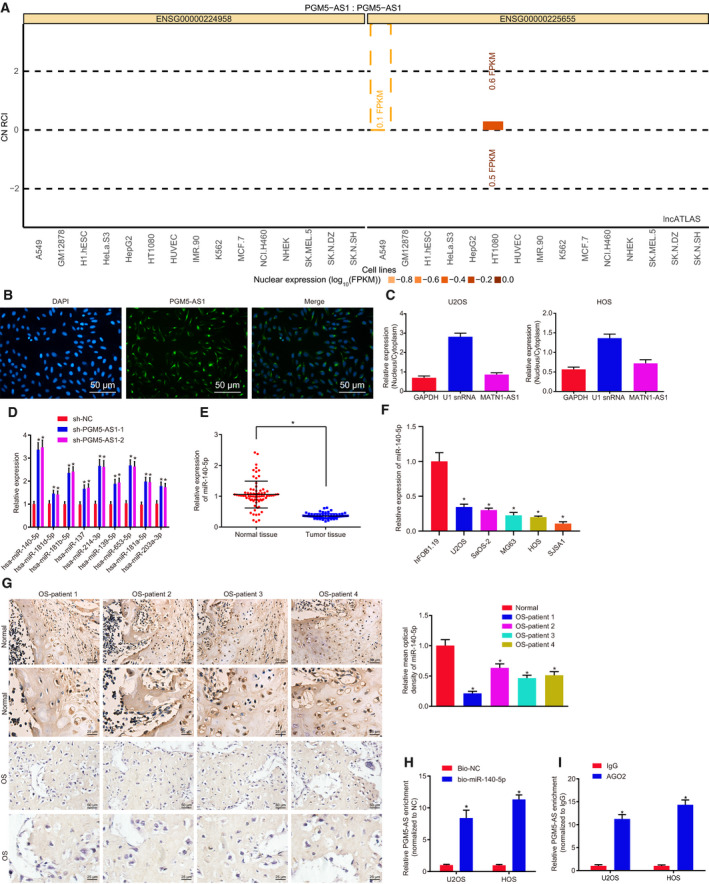
Fig. 4.

PGM5‐AS1 binds to miR‐140‐5p in osteosarcoma. (A) The expression location of PGM5‐AS1 analyzed using RNA in situ hybridization. PGM5‐AS1 expression in the cytoplasm was shown above the 0 line, and PGM5‐AS1 expression in the nucleus was shown under the 0 line. (B) The location of PGM5‐AS1 expression in U2OS cells detected using FISH (200×; scale bar = 50 μm). (C) The location of PGM5‐AS1 expression in U2OS and HOS cells analyzed by fractionation of nuclear/cytoplasmic RNA. (D) Regulatory miRNA of PGM5‐AS1 predicted using the RAID database. (E) miR‐140‐5p level in osteosarcoma tissues and adjacent normal bone tissues from 73 osteosarcoma patients determined by RT‐qPCR. (F) The expression of miR‐140‐5p in human normal cell line hFOB 1.19 and five osteosarcoma cell lines U2OS, SaOS‐2, MG63, HOS, and SJSA1 detected by RT‐qPCR. *P < 0.05, vs. human normal cell line hFOB 1.19 cells. (G) Expression of miR‐140‐5p in osteosarcoma tissues from 73 osteosarcoma patients, as measured using RNA in situ hybridization (n = 73; 400×; scale bar = 25 μm). (H) The binding between miR‐140‐5p and PGM5‐AS1 detected by RNA pull‐down assay. (I) The binding between miR‐140‐5p and PGM5‐AS1 detected by RIP assay. *P < 0.05, vs. U2OS and HOS cells treated with sh‐NC, adjacent normal bone tissues, Bio‐NC, or IgG. The data were measurement data and expressed as mean ± standard deviation. Data in E were analyzed using t‐test. Unpaired t‐test was used to analyze the data between the two groups, and one‐way ANOVA together with Tukey's post hoc test was applied in data analysis among multiple groups. The experiment was repeated three times.
