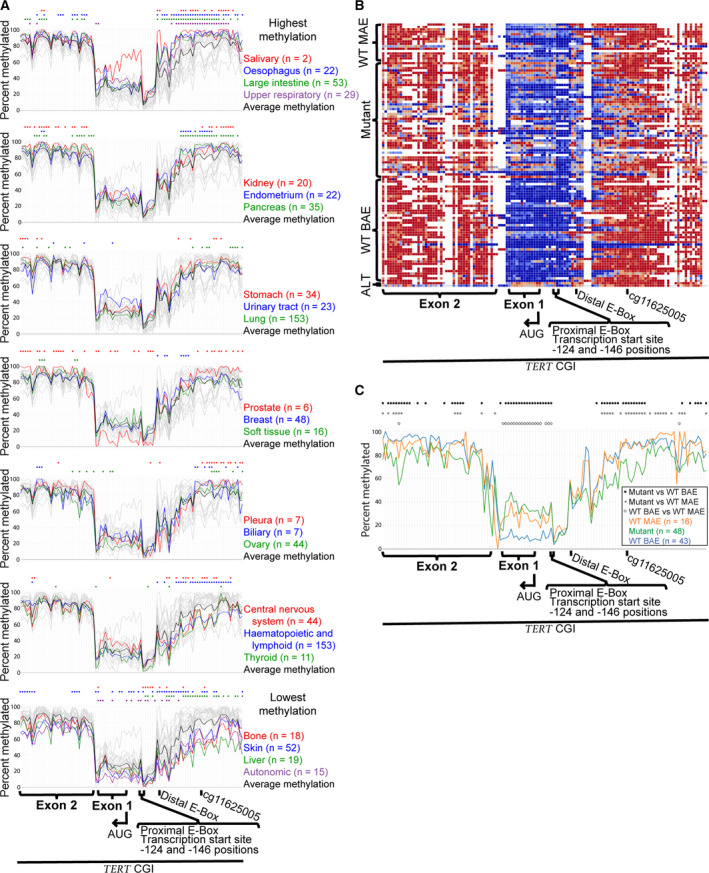
Fig. 1.

TERT promoter is characterized by conserved upstream hypermethylation and proximal hypomethylation across different cancer tissue types. (A) Bisulfite conversion sequencing (Bis‐Seq) DNA CpG methylation data for 95 positions across the TERT promoter for 23 different cancerous tissues, showing mean values from 833 cancer cell lines (n represents the number of cell lines per tissue). Colored circles indicate individual CpG sites with statistically significant (P ≤ 0.005) differences between the tissue and all other tissues. Each graph groups tissues by total mean percent methylated, from most to least methylated (top to bottom, respectively). Each chromosomal position includes data from at least two cell lines for all 23 tissues. (B) Bis‐Seq DNA CpG methylation data for 129 positions across the TERT promoter for 109 cell lines with known allelic expression and activating mutation classifications. Lines had been classified as having wild‐type (WT) monoallelic expression (MAE) of TERT (‘WT MAE’), −124 or −146 C>T activating promoter mutations (‘mutant’), biallelic expression (BAE) of TERT (‘WT BAE’), or alternative lengthening of telomeres (ALT). Each row represents a different cell line. Colors range from red to blue for more to less methylated CpGs, respectively. White represents unavailable data. Each chromosomal position includes data from at least 10 cell lines. (C) Bis‐Seq DNA CpG methylation data for 122 positions across the TERT promoter for 107 cell lines shown in 1B (n represents the number of cell lines per tissue). Colored circles indicate statistically significant (P ≤ 0.05) differences in the listed pairwise comparisons, where statistical analysis was performed using 2‐tailed Student's t‐test with unequal variance. Each chromosomal position includes data from at least two cell lines for all three cell types. See Table S1 for chromosomal positions and Table S2 for cell line data.
