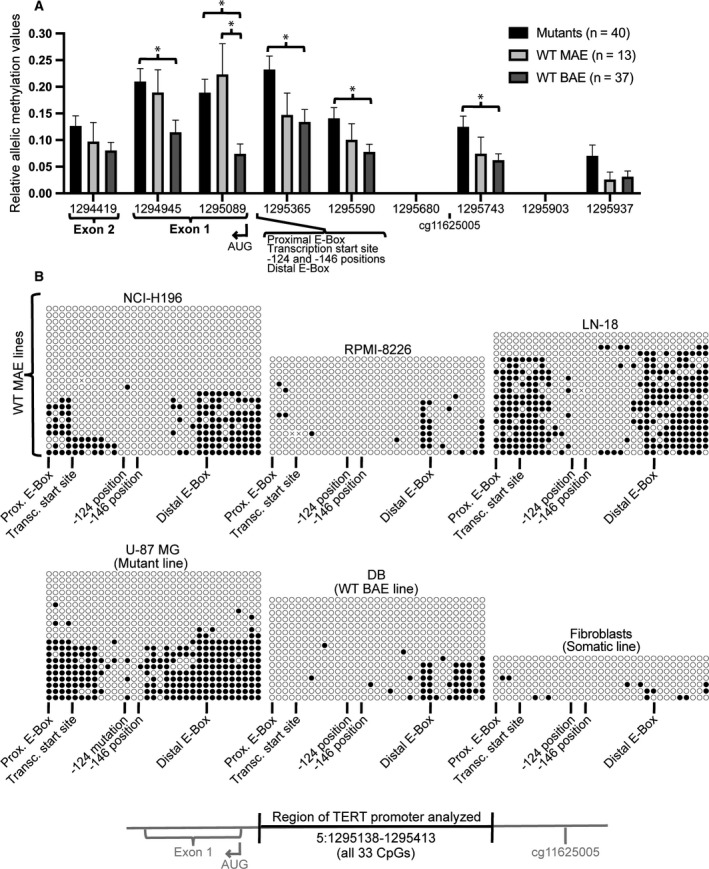
Fig. 2.

Cells with monoallelic expression of TERT have allelic methylation of the proximal TERT promoter. (A) Extent of allelic methylation across the TERT gene, which is transcribed from right to left. Relative allelic methylation was measured by calculating the difference between the mean and mode values of raw read Bis‐Seq CpG methylation data, where greater levels suggest greater allelic methylation behavior (see Fig. S3 for examples). Positions included contained 3–6 CpGs per read and coverage of ≥ 5 reads per cell line. Error bars represent standard error of the mean. n represents the number of cancer cell lines. *P ≤ 0.05, where statistical analysis was performed using 2‐tailed Student's t‐test with unequal variance. (B) Bisulfite conversion cloning data from genomic DNA of select CpGs flanking the TERT transcription start site (5:1295138–1295413, spanning 33 CpGs). Each row represents a different clone (or genome copy, or allele) and each circle represents a CpG, with black circles representing a methylated CpG and white circles representing an unmethylated CpG. For chromosomal positions of noted TERT features, see Table S1.
