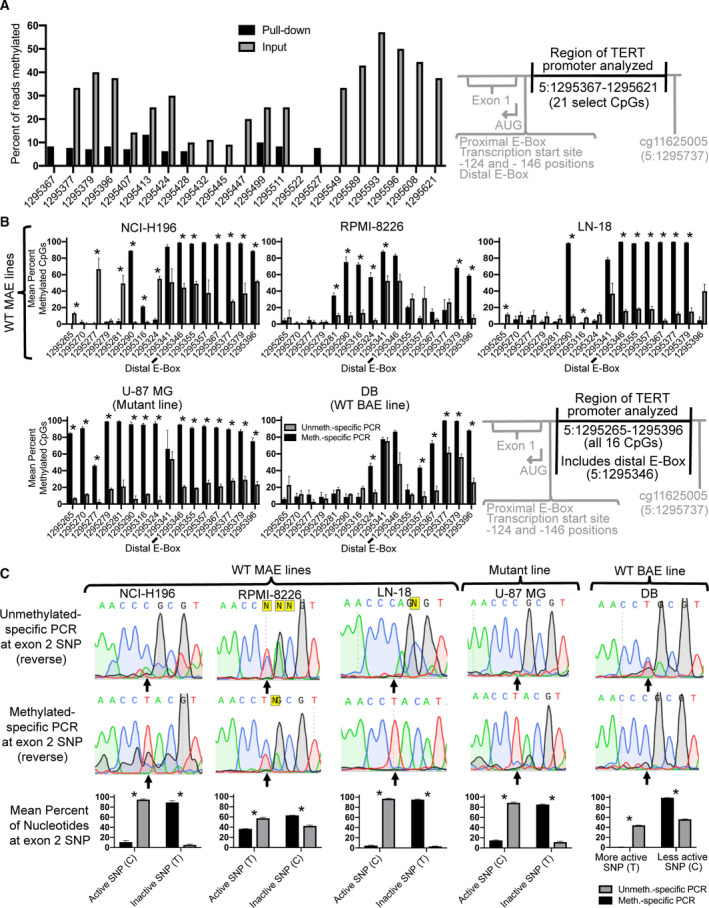
Fig. 3.

Decreased TERT promoter methylation associates with histone marks of active transcription and an active exonic SNP. (A) ChIP‐Bis‐Seq of the TERT promoter using an H3ac antibody shows enrichment of unmethylated DNA in the pulled‐down samples (black) relative to the input (gray) in LN‐18 cells. The absence of any bars indicates zero percent methylation. Inclusion criteria for read positions were a greater number of reads in the pull‐down relative to the input and ≥ 10 reads in the pull‐down (mean input coverage was 9 reads; mean pull‐down coverage was 13 reads; P = 0.01 for pull‐down efficiency). (B) Confirmation of long‐range bisulfite conversion PCR enriching for unmethylated or methylated CpGs at the TERT proximal promoter (16 CpGs spanning 5:1295265–1295396; region overlaps with some of the CpGs analyzed in 3A) using unmethylated (gray)‐ or methylated (black)‐specific bisulfite conversion PCR, respectively. PCR products generated a 1448‐bp product including the proximal promoter and the exon 2 SNP analyzed in Panel C. *P ≤ 0.05 (C) Long‐range bisulfite conversion PCR (same PCRs as shown in Panel B) showing representative Sanger sequencing results (upward arrow indicates position of the exon 2 SNP) and graphs of the sequencing results (n = 2–3 sequenced reactions). ‘Active SNP’ means that the nucleotide at the position of the SNP is the one found in the TERT mRNA transcribed in that cell line. The active SNP was either previously identified in all cell lines [14] or was identified here (Fig. S6). Error bars represent standard error of the mean. *P ≤ 0.01, where statistical analysis was performed using 2‐tailed Student's t‐test with unequal variance.
