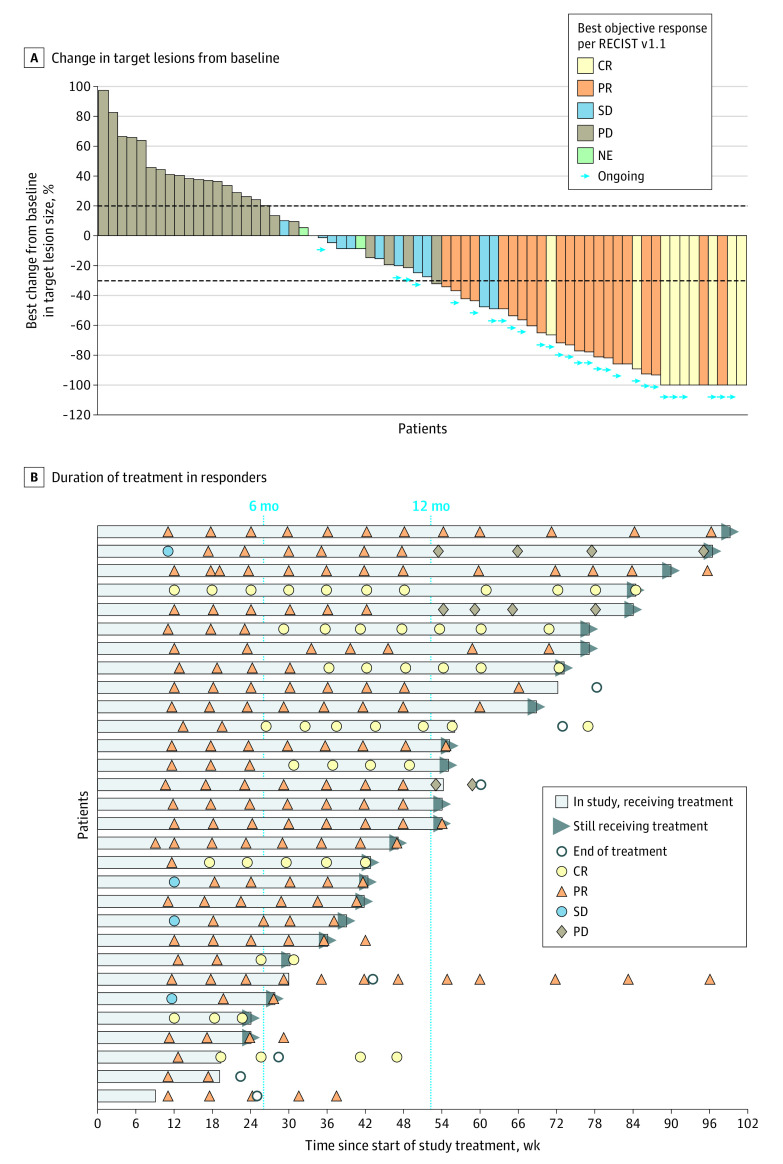
Figure 2. Tumor Best Percentage Change in Lesion Size From Baseline in the Efficacy-Evaluable Population (n = 71) and Duration of Treatment in Responders (n = 30).
A, Waterfall plot shows the maximum percentage change in target lesions from baseline, indicated by bar length; best overall response is indicated by color coding of bars and includes assessment of target, nontarget, and new lesions. B, Swimmer lane of duration of treatment for patients with an objective response. Patients were permitted to remain receiving treatment after progression if they were considered to be benefiting from treatment. (Two examples of this can be seen in lanes 2 and 5; in both cases, patients had progressive disease [PD] based on Response Evaluation Criteria in Solid Tumors version 1.1 [RECIST v1.1] but were considered to be still responding per immune-related RECIST and continued receiving dostarlimab. The patient represented in lane 5 had progression based on immune-related RECIST on May 15, 2019.) Computed tomography scans after treatment discontinuation were used to monitor disease for follow-up. All assessments are based on blinded independent centralized review per RECIST v1.1. Ongoing indicates that patients were continuing to receive treatment at time of the data cutoff. CR indicates complete response; NE, not evaluable; PR, partial response; and SD, stable disease.

