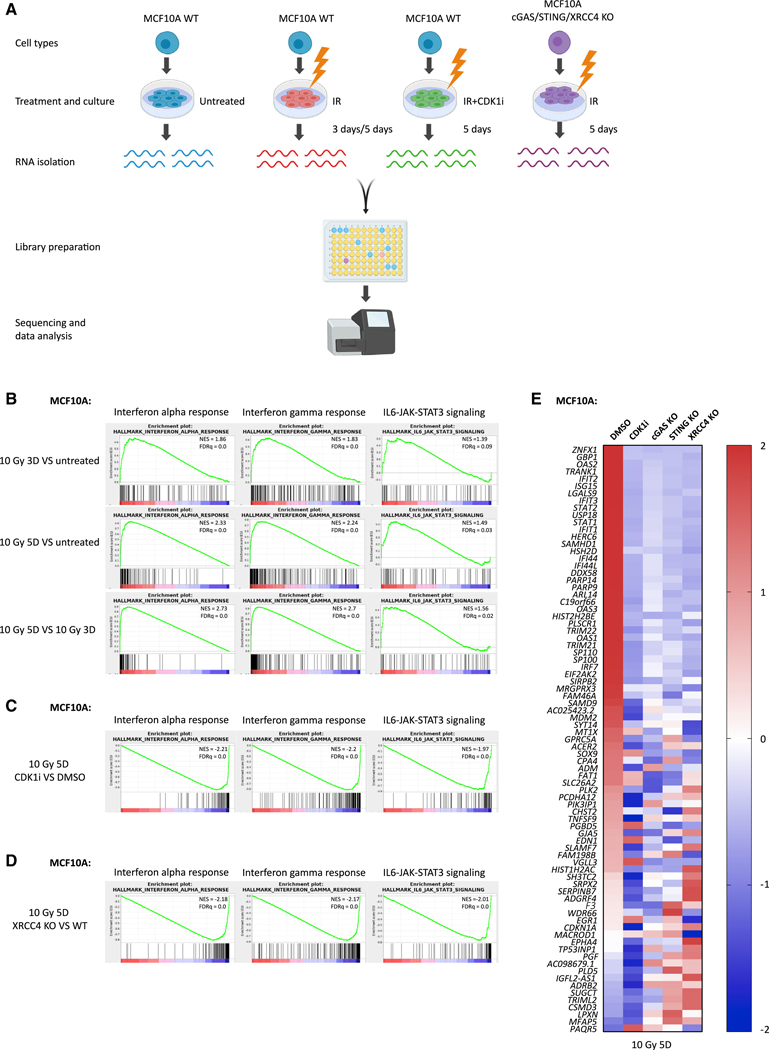
Figure 1. G2/M Cell Cycle Arrest or c-NHEJ Deficiency Suppresses IR-Induced Inflammatory Signaling.
(A) Scheme showing the library preparation workflow for RNA-seq. Created with BioRender.
(B–D) Gene set enrichment analysis (GSEA) of RNA-seq data in MCF10A cells to identify enriched biological pathways at 3 days after 10 Gy versus untreated cells, 5 days after 10 Gy versus untreated cells, and 5 days versus 3 days after 10 Gy (B); 5 days after 10 Gy with CDK1i versus 5 days after 10 Gy with DMSO (C); and 5 days after 10 Gy in XRCC4 KO versus 5 days after 10 Gy in WT (D), respectively. Significant GSEA enrichment score curves were noted for interferon-α response, interferon-γ response, and IL6-JAK-STAT3 signaling. The green curve in the displayed GSEA thumbnails represents the enrichment score curve. Genes on the far left (red) correlated with treatment condition, and genes on the far right (blue) correlated with the control condition. The vertical black lines indicate the position of each gene in the studied gene set. The normalized enrichment score (NES) and false discovery rate (FDRq) are shown for each pathway.
(E) Heatmap showing the Z score of FPKM expressions in control, CDK1i, cGAS KO, STING KO, and XRCC4 KO MCF10A cells for genes differentially expressed at 5 days after 10-Gy treatment (fold change > 2; p value < 1e10).
See also Figure S1.

