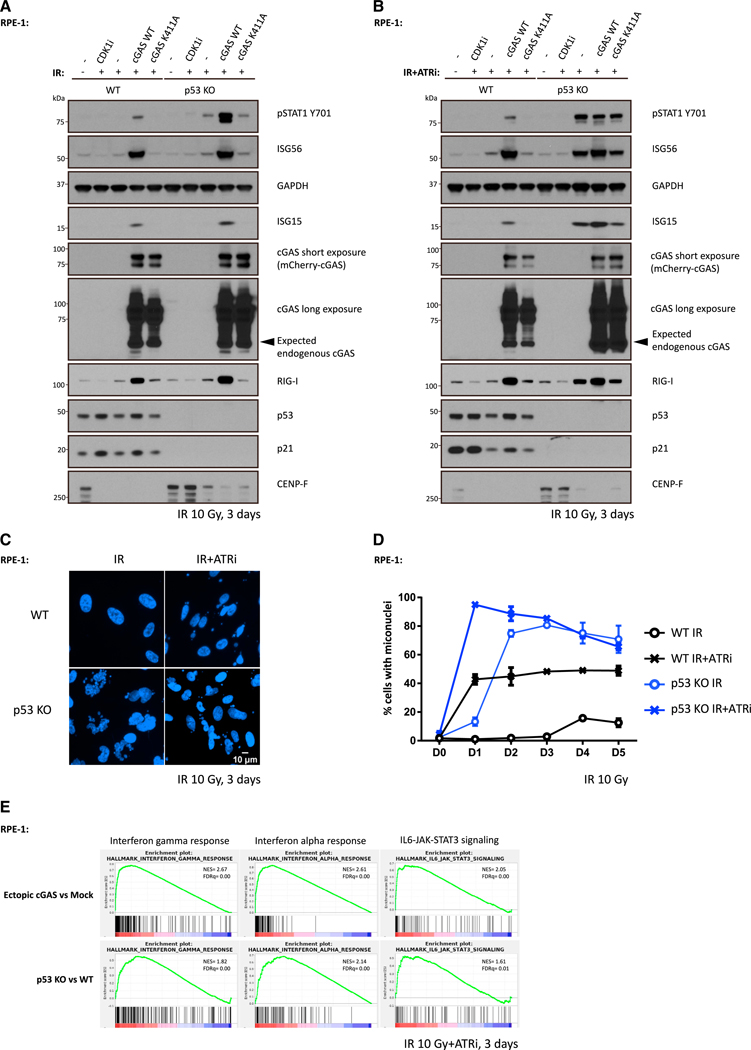
Figure 5. p53 Loss Cooperates with ATR Inhibition to Activate cGAS-Independent Inflammatory Signaling.
(A and B) WT cells or p53 KO cells were irradiated with 10 Gy and cultured in medium with (A) or without (B) ATR inhibitor followed by collection for western blot analysis 3 days later.
(C and D) WT cells or p53 KO cells were irradiated with 10 Gy and maintained in medium with or without ATR inhibitor before fixation at indicated time. Cells with micronuclei were qualified (D), and representative images for cells with micronuclei 3 days after IR are shown in (C). Mean values and SEM (n = 2) are plotted.
(E) RNA-seq data of ectopic cGAS versus mock and p53 KO versus WT were interrogated by gene set enrichment analysis (GSEA) to identify enriched biological pathways in RPE-1 cells 3 days after 10 Gy irradiation in the presence of ATR inhibitor, respectively. Significant GSEA enrichment score curves were noted for interferon-a response, interferon-g response, and IL6-JAK-STAT3 signaling. In GSEA thumbnails, the green curve represents the enrichment score curve. Genes on the far left (red) correlated with former cells, and genes on the far right (blue) correlated with latter cells. The vertical black lines indicate the position of each gene in the studied gene set. The normalized enrichment score (NES) and false discovery rate (FDR) are shown for each pathway.
See also Figure S4.

