Figure 6.

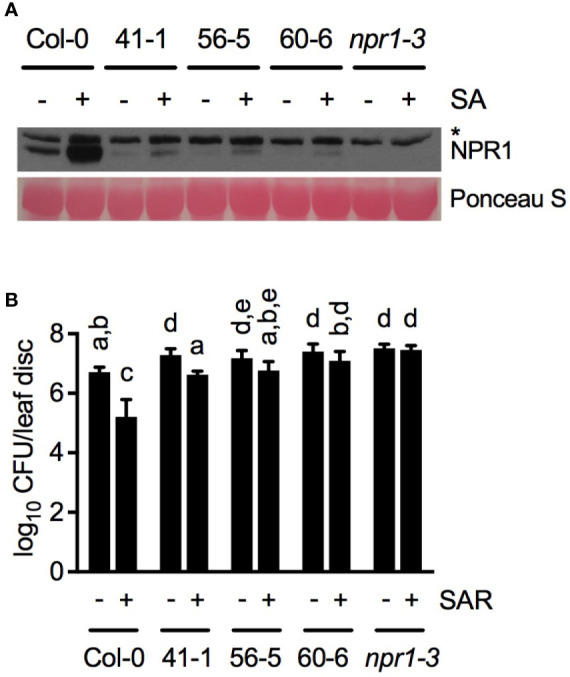
Characterizations of transgenic plants with NPR1 protein levels lower than the wild-type basal level. (A) SA-induced NPR1 protein accumulation in Col-0, npr1-3, and three independent ELP3pro:NPR1 transgenic lines. Total protein extracted from leaf tissues collected 24 h after SA (+) or water (-) treatment was analyzed by reducing SDS-PAGE and immunoblotting with anti-NPR1 antibody. The asterisk indicates a non-specific band. (B) Biological induction of SAR in Col-0, npr1-3, and the three independent ELP3pro:NPR1 transgenic lines. Three lower leaves on each plant were inoculated with Psm ES4326 (OD600 = 0.002) (+SAR) or mock-treated with 10 mM MgCl2 (-SAR). Two d later, two upper uninfected/untreated leaves were challenge-inoculated with Psm ES4326 (OD600 = 0.001). The in planta bacterial titers were determined 3 d after challenge inoculation. Data represent the mean of eight independent samples ± SD. Different letters above the bars indicate significant differences (P < 0.05, one-way ANOVA). The experiments were repeated three times with similar trend.
