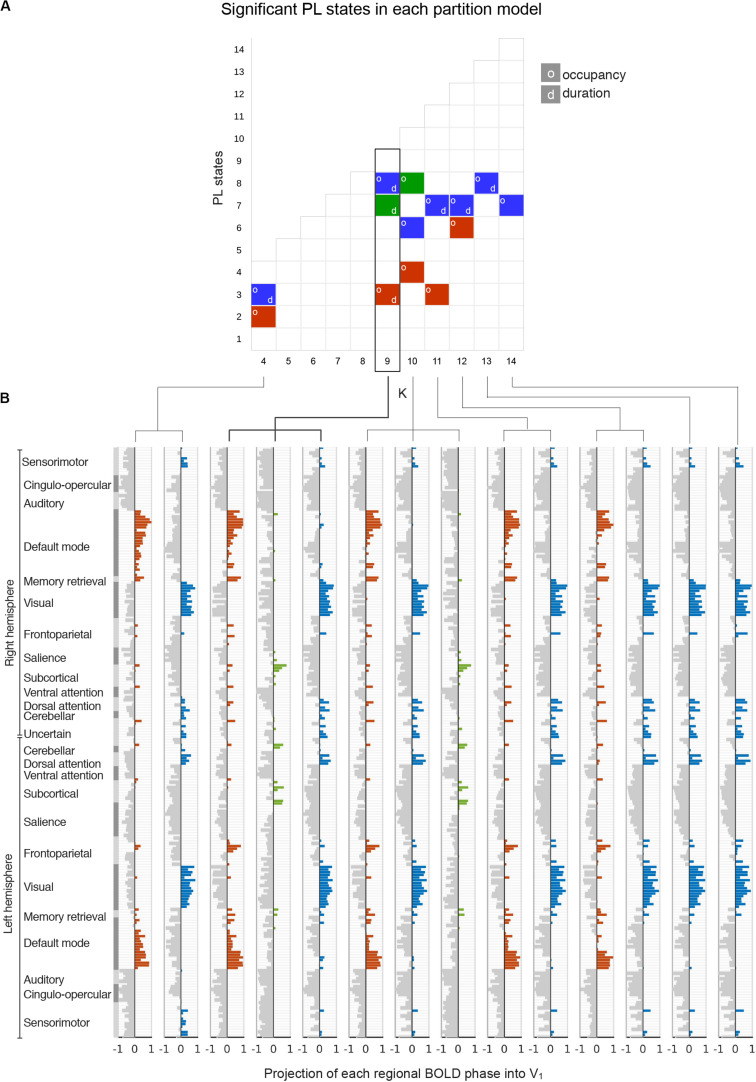
FIGURE 3.
Detection of significant between-group differences in PL states across partition models. (A) Each square in the matrix represents a PL state (or cluster) obtained for each k-means partition model with k varying between k = 4 and k = 14 (x-axis). PL states that are significantly different between low and high MDI (p-FDR < 0.05), either in terms of percentage of occupancy (o) or duration (d), are indicated by colored squares. Since significantly different PL states obtained for different k were found to represent variant forms of 3 underlying configurations of BOLD phase locking (see panel B), we used a color-code (blue, red, green) to illustrate how these different configurations occurred across k. (B) The cluster centroids, Vc, of significantly different PL states identified in panel A are represented as bar plots. Here, each horizontal bar represents the BOLD phase in each of the N = 223 brain regions projected into the corresponding leading eigenvector (captured by the N elements in Vc). The regions n whose BOLD signal is phase-shifted (Vc(n) > 0) were colored using the same color-code from panel A. MDI, Major Depression Inventory; PL, phase-locking.

