Figure 7.
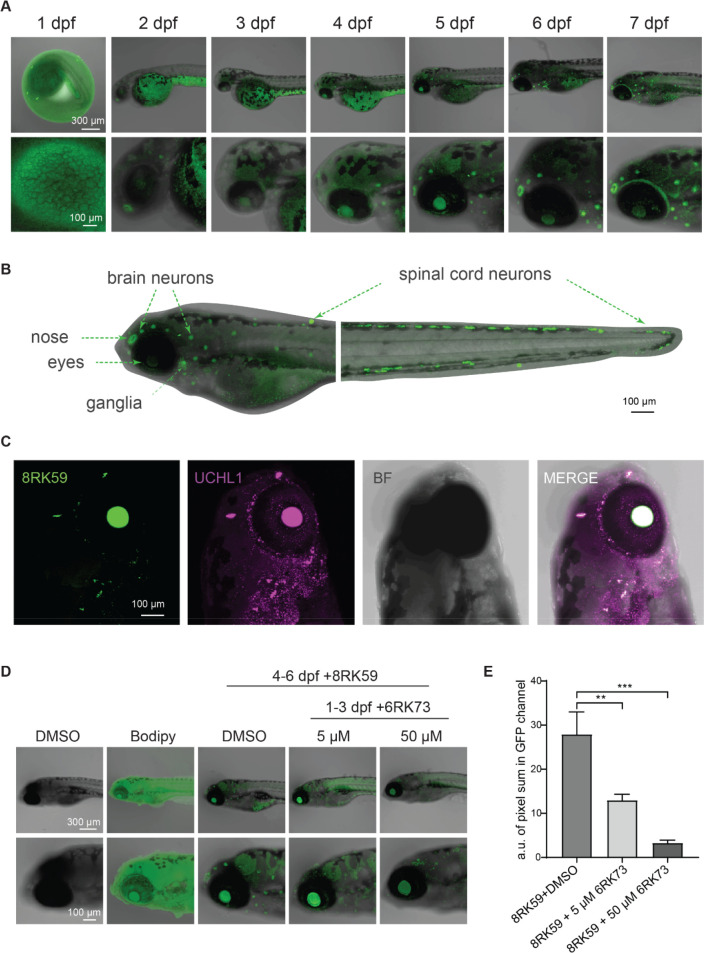
Monitoring spatiotemporal UCHL1 activity during the development of zebrafish embryos with 8RK59. (A) Tracking the localization of active UCHL1 with 5 μM 8RK59 of zebrafish embryos from 1 to 7 dpf. (B) Landscape of UCHL1 activity in a 6 dpf zebrafish embryo. UCHL1 activity-enriched areas (ganglia, eyes, nose, brain neurons, and spinal cord neurons) are indicated with arrows. (C) IF staining of UCHL1 in a 5 μM 8RK59-labeled 6 dpf zebrafish embryo. A representative image of UCHL1-enriched areas in the brain of 6 dpf zebrafish embryo is shown. BF, brightfield image. (D) Monitoring UCHL1 activity staining intensity of 8RK59-labeled 6 dpf zebrafish embryos pretreated with/without UCHL1 activity inhibitor 6RK73 for 1–3 dpf. DMSO and BodipyFL dye were used as controls. (E) Statistical analysis of the 8RK59 signal in 6 dpf zebrafish embryos pretreated with/without UCHL1 activity inhibitor 6RK73. The intensity of 8RK59 was measured in three zebrafish embryos of each group by calculating the pixel sum in the GFP channel. **, P < 0.01, ***, P < 0.001, and two-way ANOVA.

