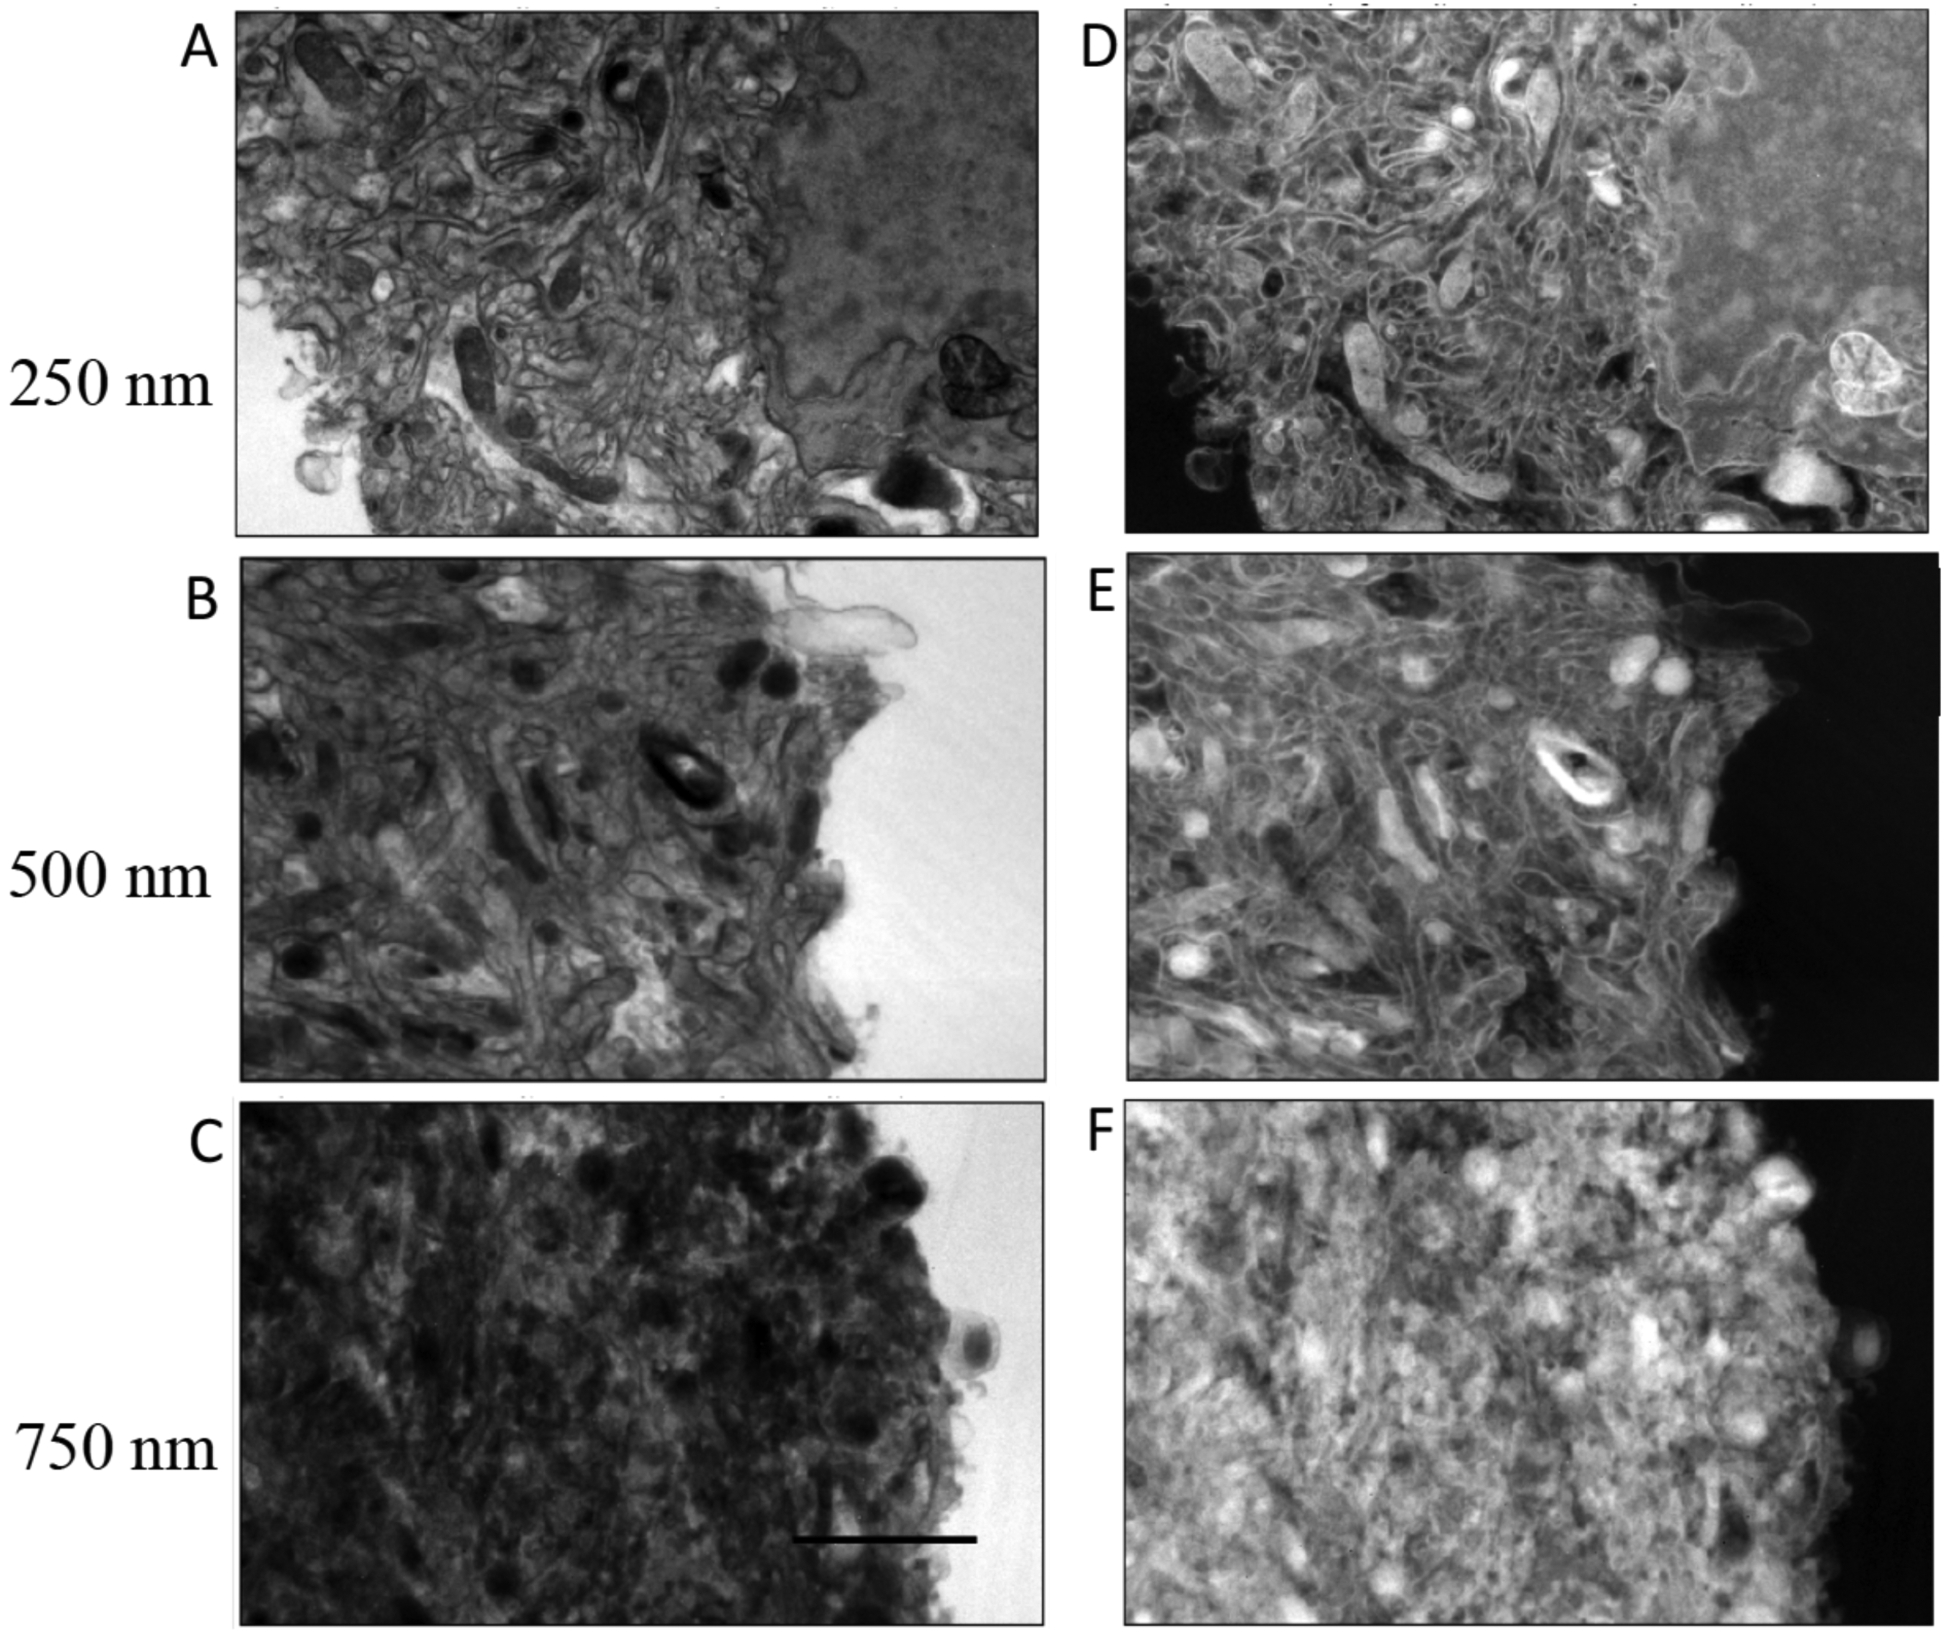
Figure 3.

Analysis of bright-field TEM images I(x, y) from sections of mouse brain in specimens of different thicknesses: (A) 250 nm; (B) 500 nm; (C) 750 nm. Corresponding computed images of ln[Iresin/I(x, y)] are shown in (D) for the 250-nm section; (E) for the 500-nm section; and (F) for the 750-nm section. Values for Iresin were obtained by averaging the intensity of the pixels contained in regions of clear embedding resin surrounding the cells. Scale bar = 2 μm.
