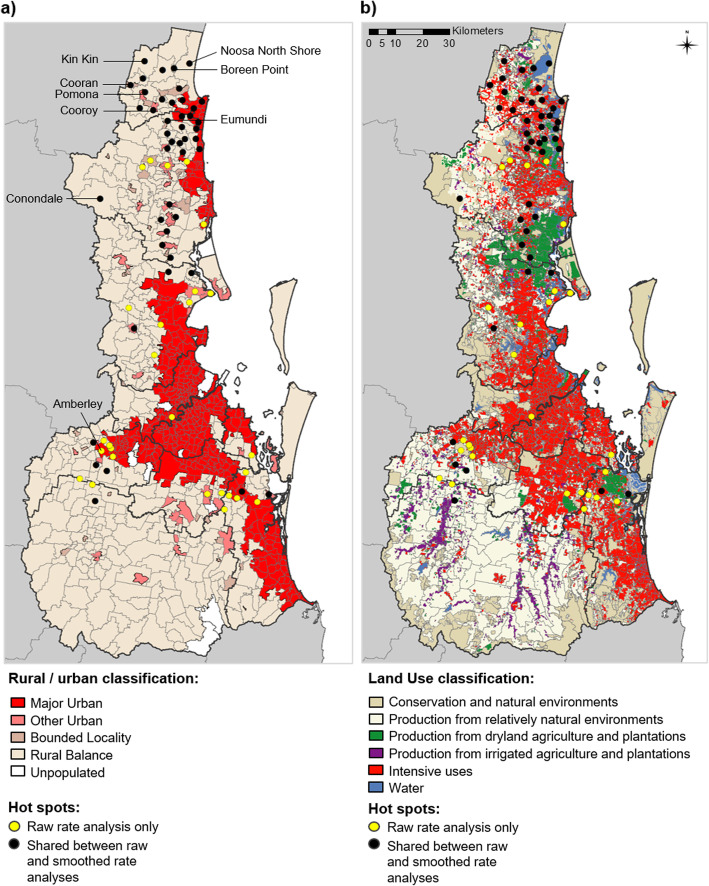
Fig. 6.
Persistent high incidence hot spots in south east Queensland, 2001–2016. Persistent hot spots identified for State Suburb Codes (SSCs) are shown relative to a) urban and rural areas of south east Queensland; and b) different land use types of south east Queensland. Points indicate the centroid of each hot spot SSC. Hot spots detected using raw incidence rates only (yellow points; n = 27 SSCs) and those detected in both raw and smoothed incidence analyses (black points; n = 45 SSCs) are indicated. Note: in b) ‘Intensive uses’ refers to residential areas and urban infrastructure. See methods for further description

