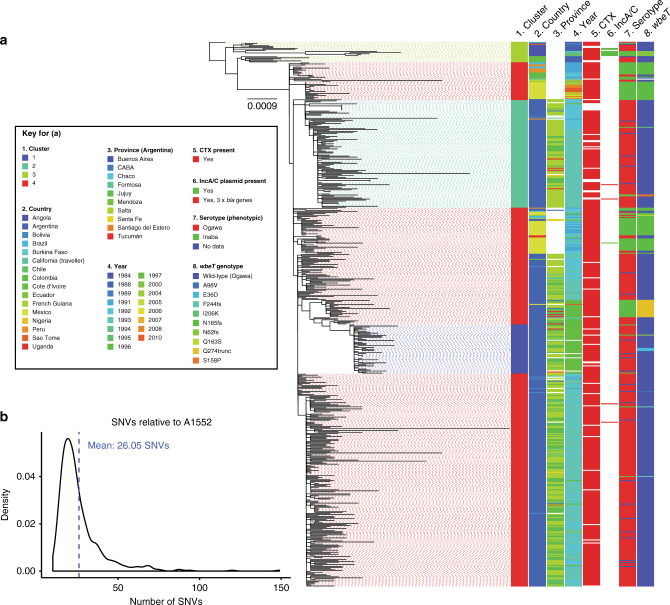
Fig. 3. A phylogeny of the LAT-1 sub-lineage.
a A maximum-likelihood phylogeny was calculated from 2,651 non-recombinant SNVs determined relative to the A1552 reference sequence (see Methods). The tree is rooted on the sequence of CNRVC980048, an isolate lacking WASA-1 from Burkina Faso, 1984. Scale bar denotes the number of mutations per variable site. Clusters were defined using Fastbaps using an alignment of 725 parsimony-informative SNVs. Metadata are reported where available; gaps are presented where data were unavailable, not determined, or recorded as no data. Initial figure produced using iCANDY and re-coloured manually (Adobe Illustrator CC). b Density plot illustrating the number of SNVs separating each of the LAT-1 isolates from the A1552 reference sequence. The blue line indicates the mean (26.05 SNVs). Interactive phylogeny available in Microreact (https://microreact.org/project/VAZD_K0kZ).

