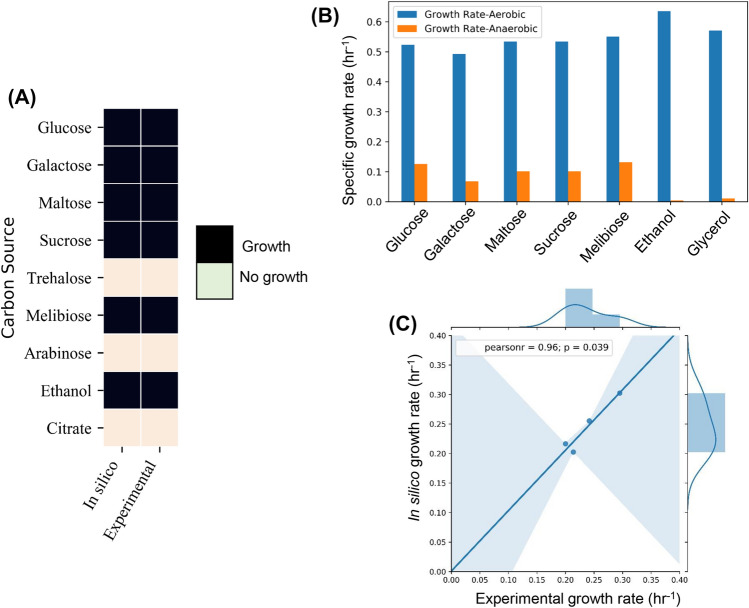
Figure 3.
Viability and growth on various carbon sources in comparison to experimental reports. (A) Comparative analysis of in silico viability on multiple carbon sources and the reported data in MycoBank and other literature. (B) The in silico specific growth rate (h−1) simulated by FBA of L. kluyveri on different carbon sources in both aerobic and anaerobic conditions. The error bars represent the maximum and minimum specific growth rate for flux variability analysis. (C) The correlation between the experimental growth rate and in silico growth rate on various carbon sources.

