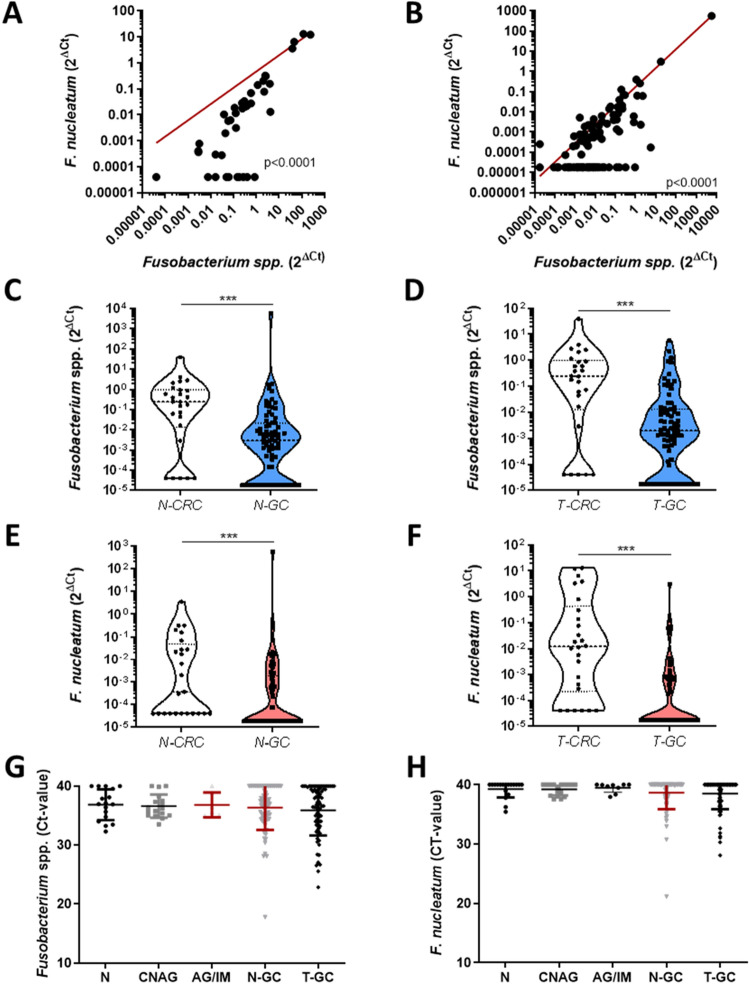
Figure 3.
Difference in Fusobacterium spp. and F. nucleatum between colon, gastric mucosa and abundance in preneoplastic gastric mucosa. (A) Correlation between normalized Fusobacterium spp. and F. nucleatum in N-CRC and T-CRC specimens. (B) Correlation between normalized Fusobacterium spp. and F. nucleatum in N-GC and T-GC specimens. (C) Relative abundance of Fusobacterium spp. in N-CRC (n = 26) and N-GC (n = 78) (p < 0.0001). (D) Relative abundance of Fusobacterium spp. in T-CRC (n = 26) and T-GC (n = 79) (p < 0.0001). (E) Relative abundance of F. nucleatum in N-CRC (n = 25) and N-GC (n = 79) (p < 0.0001). (F) Relative abundance of F. nucleatum in T-CRC (n = 26) and T-GC (n = 80) (p < 0.0001). (G) Abundance of Fusobacterium spp. in N (n = 17), CNAG (n = 17), AG/IM (n = 6), N-GC (n = 78) and T-GC (n = 81) tissues in GC (p = 0.97). (H) Abundance of F. nucleatum in N (n = 18), CNAG (n = 17), AG/IM (n = 9), N-GC (n = 78) and T-GC (n = 80) in GC (p = 0.86). Relative abundance is presented as 2ΔCT values normalized to PGT. Undetectable values were set to the lowest measurable normalized value. Mann–Whitney-test was used for statistical analysis of two groups and Kruskal–Wallis test for more than two groups.

