Figure 6.
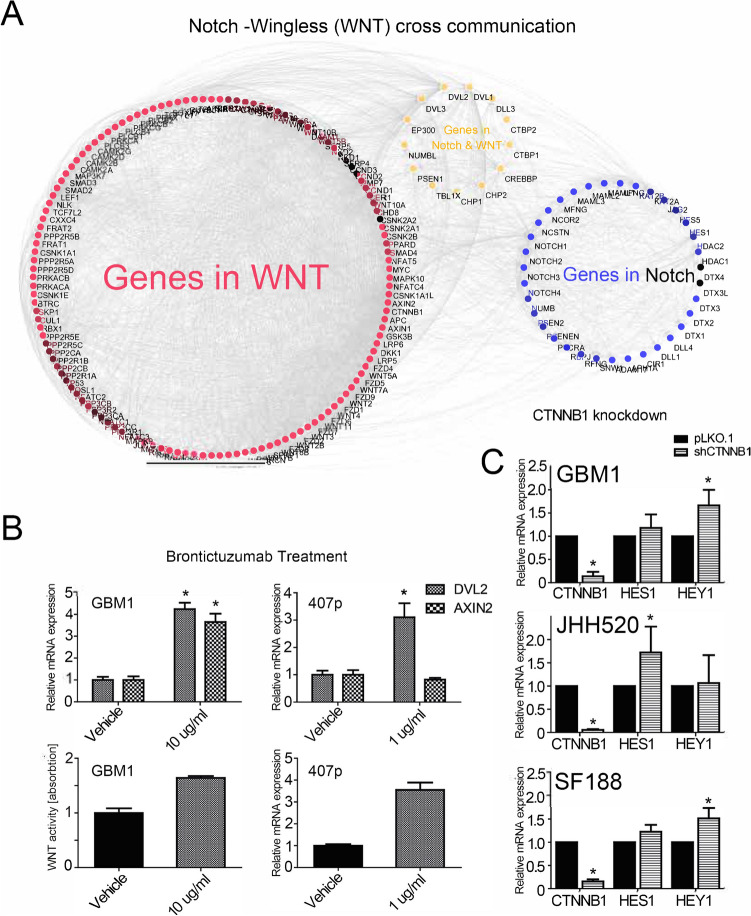
Upregulation of WNT signals in response to BRON treatment. (A) Proteins in Notch and WNT pathways showed extensive interactions as revealed by co-occurrence of target genes in both pathways. Red dots represent proteins of the WNT network whereas blue dots represent members of the Notch signaling cascades. Yellow dots represented proteins in both Notch and WNT branch. (B) BRON treatment caused activation of expression of consensus WNT target genes (AXIN2, DVL2) and pathway reporter signals in GSCs. (C) Genetic suppression of WNT signaling with RNA interference against transcriptional pathway signal mediator beta-catenin (CTNNB1) caused induction of Hes1/Hey1 transcripts.

