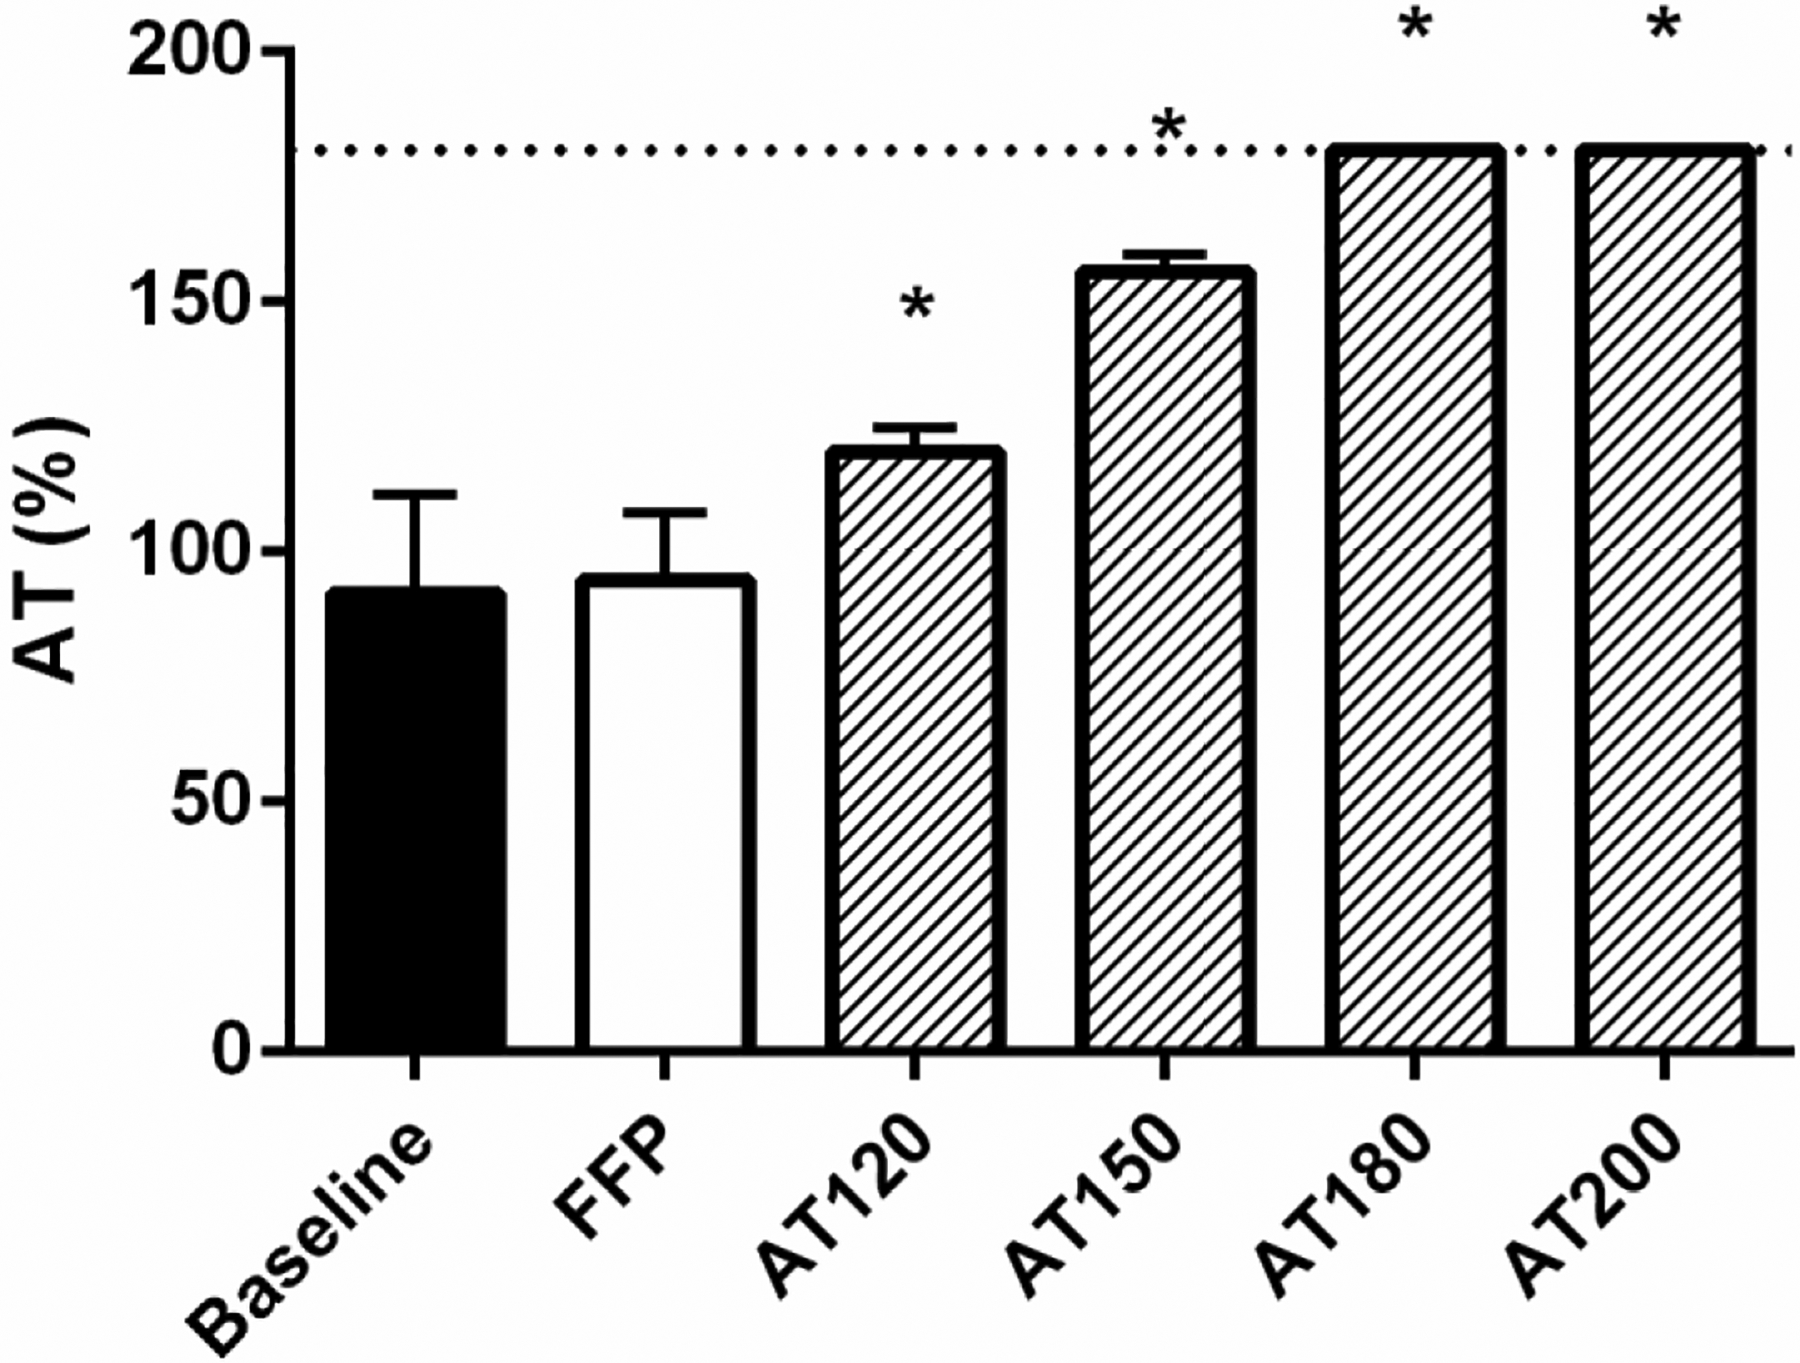
Figure 2: Antithrombin (AT) levels in trauma patient plasma at baseline and following treatment with fresh frozen plasma (FFP) or AT concentrate.

AT is presented as percent activity. FFP treatment was 30% by volume. AT was supplemented to 120, 150, 180, or 200% final concentration. Data are presented as means with standard deviation. The dotted line represents the limits of detection. * denotes p<0.05 compared to baseline following one-way ANOVA analysis with Bonferroni correction.
