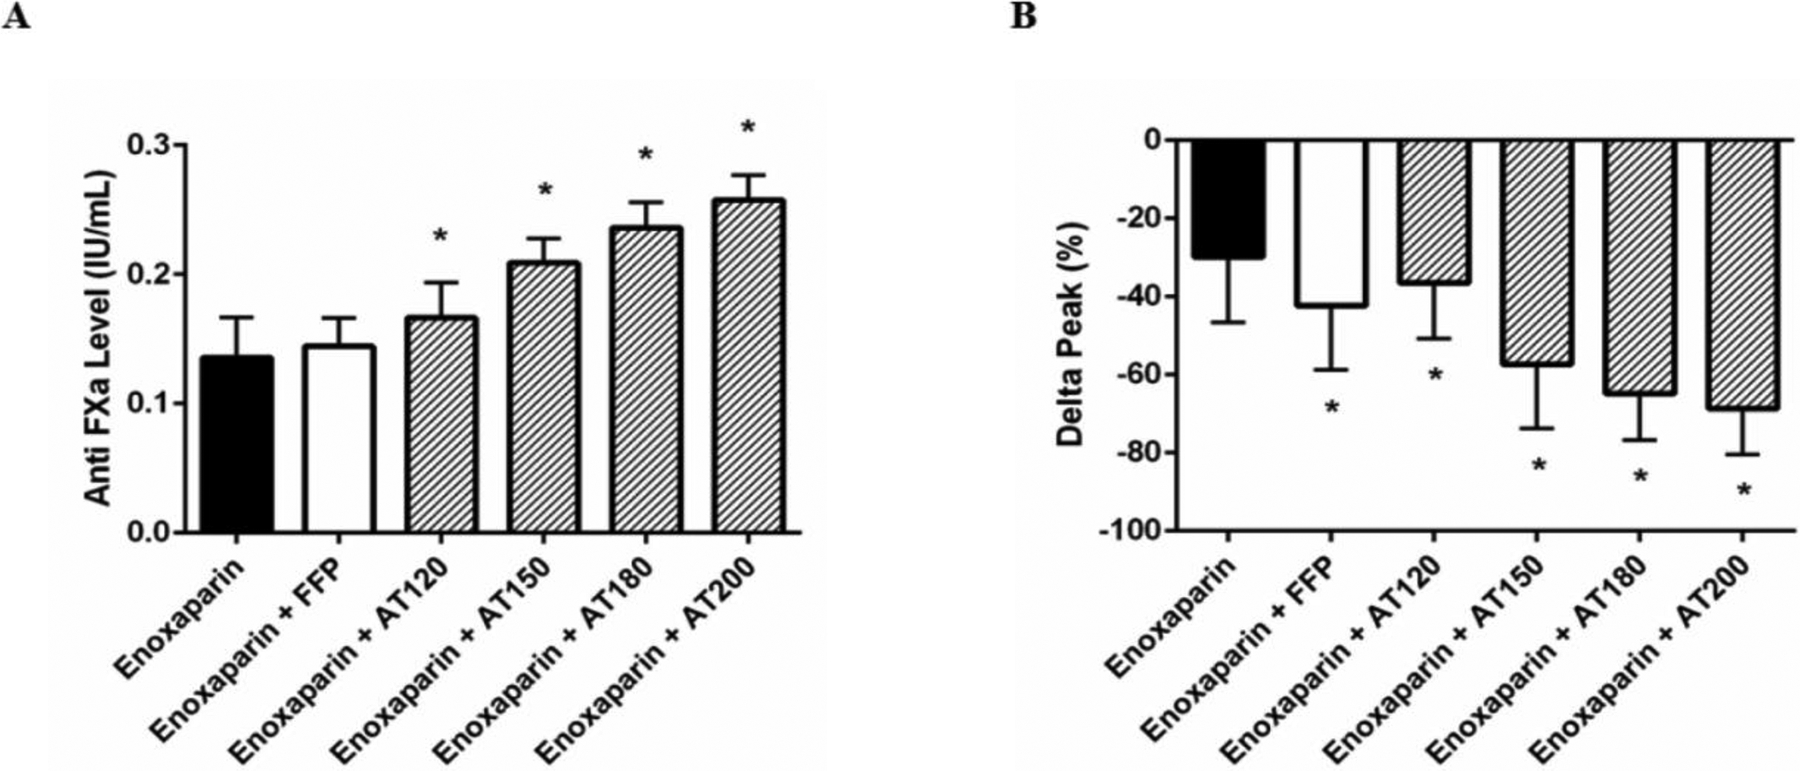
Figure 3. Levels of Anti-FXa and thrombin following enoxaparin treatment.

Anti-FXa levels (A) and changes in peak thrombin (B) were measured in trauma patients following treatment of their plasma with enoxaparin in the presence or absence of FFP or AT supplementation. Delta peak represents the percent change of thrombin in treated plasma compared to untreated plasma at baseline. Data are presented as means with standard deviation. * denotes p<0.05 compared to enoxaparin alone following one-way ANOVA analysis with Bonferroni correction.
