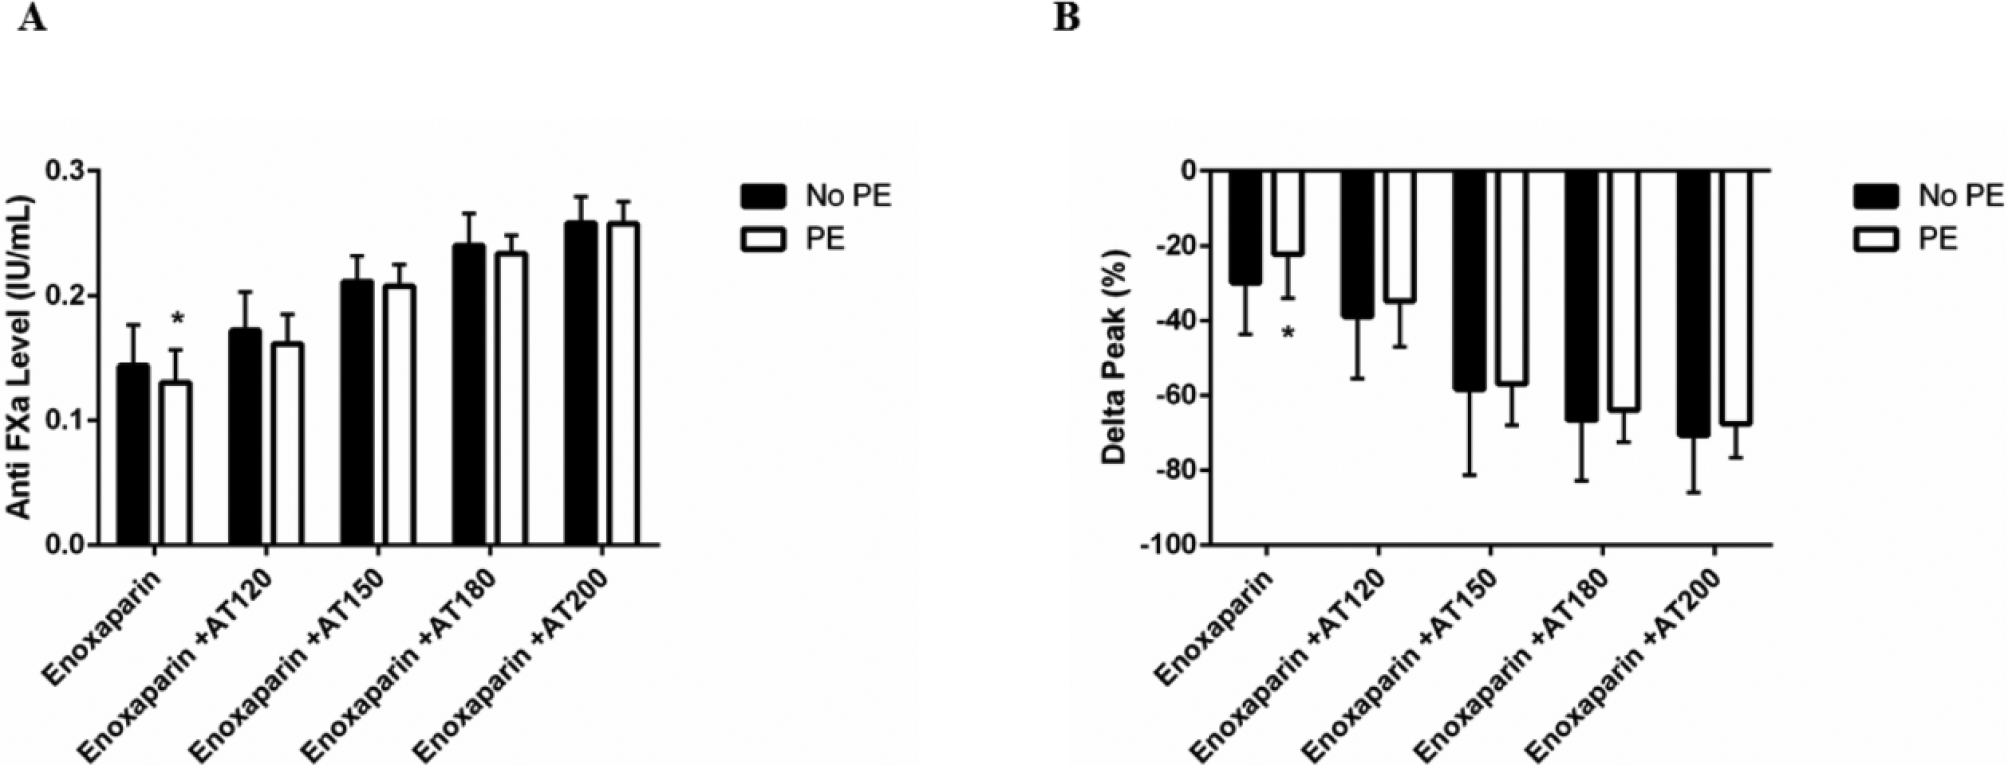
Figure 4. Levels of Anti-FXa and thrombin following enoxaparin treatment of PE vs no PE patients.

Anti-FXa levels (A) and changes in peak thrombin (B) were measured in plasma from patients who did (white bar) or did not develop a PE (black bar) following treatment with enoxaparin in the presence or absence of FFP or AT supplementation. Data are presented as means with standard deviation. * denotes p<0.05 comparing “PE” and “No PE” patients after two-way ANOVA analysis with Sidak correction.
