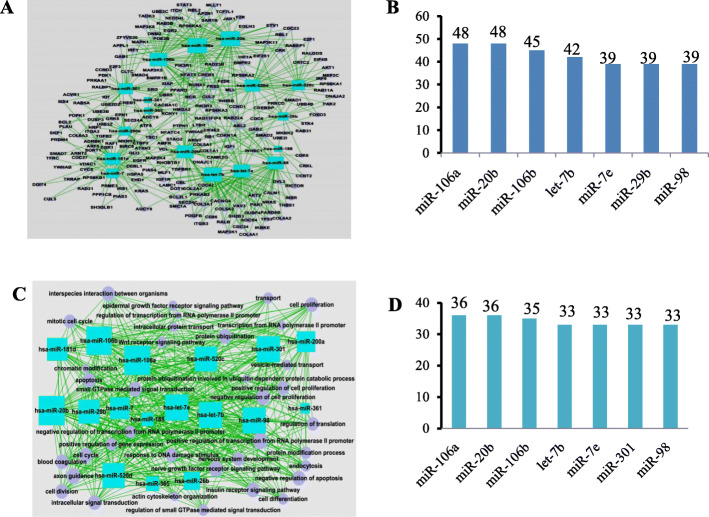
Fig. 1.
Screening of breast cancer stem cells (BCSCs)-associated miRNAs via miRNA networks. a In the miRNA-gene network, the rectangle in the figure represents upregulated miRNAs, the circle represents genes, and the line represents the regulatory relationship between miRNAs and genes; b The regulatory degrees of miRNAs in the miRNA-gene network; c In the miRNA-GO network, the rectangle in the figure represents miRNAs, the circle represents GO terms, and the straight line represents the regulatory relationship between miRNAs and GO terms. The more miRNAs regulating a GO term, the larger its area; d The regulatory degrees of miRNAs in the miRNAs-GO network

