Fig. 1.
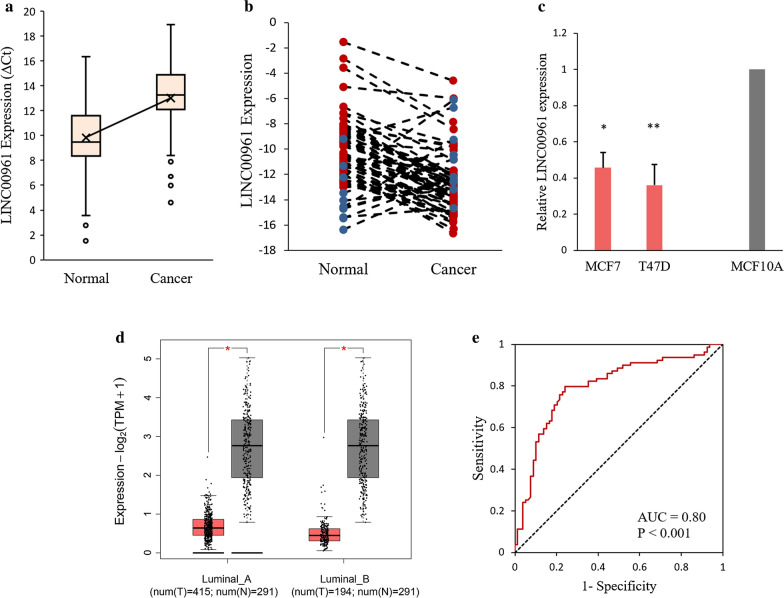
LINC00961 was downregulated in luminal A and B BC. a The expression level of LINC00961 detected by qRT-PCR in 79 luminal BC tissues and matched adjacent non-tumoral tissues. Results were presented as ΔCt in cancer tissues relative to adjacent tissues. b The relative expression of LINC00961 in two BC cell lines compared with normal breast cell line. c Downregulation of LINC00961 in 86% of samples compared to their adjacent non-tumoral tissues. Red bullets are representative of samples which LINC00961 was downregulated in. B2M was used as an internal control. Data were presented as the mean ± SD. *p-value = 0.008, **p-value = 0.010. β2M Beta-2-microglobulin. d Expression analysis of LINC00961 across BRCA in luminal A and B tumoral and normal samples, retrieved from the GEPIA web server. Red and gray colors are representative of tumor and normal samples, respectively. The expression levels were calculated using the log2(TPM + 1) scale. e ROC curve of LINC00961 in luminal BC. The X axis, “1-Specificity”, represents false positive rate and the Y axis, “Sensitivity”, displays true positive rate

