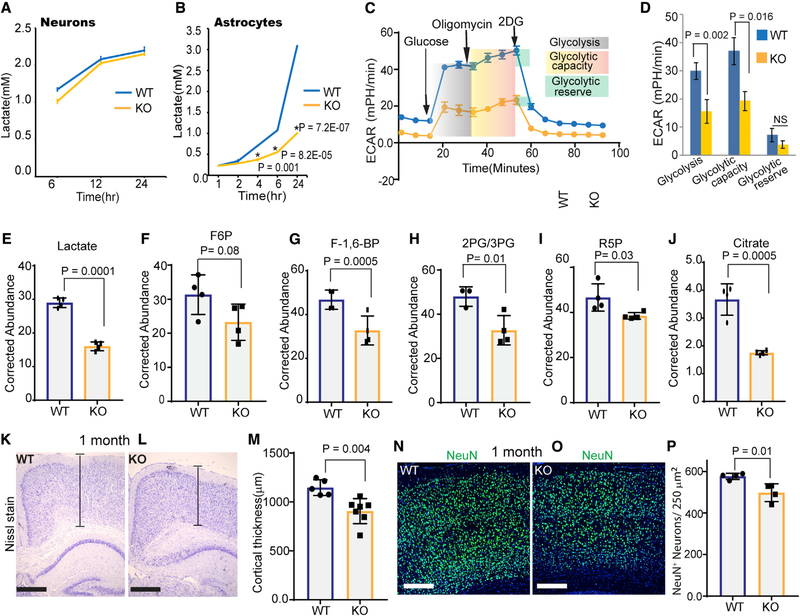
Figure 3. Ampk Deficiency in Astrocytes Reduces Glycolysis, Cortical Thickness, and Neuronal Number.
(A and B) Lactate released into the media by WT or Ampk-null neurons (A) and astrocytes (B). Error bars are mean ± SEM. n = 3 biological replicates.
(C and D) WT and Ampk KO astrocytes were tested for their glycolytic capacity and ECAR (extracellular acidification rate) on a Seahorse XFe96 Analyzer. A representative plot of ECAR over time of cells with addition of glucose (10 mM), oligomycin (1 μM), and 2-DG (50 mM), as indicated (C). Quantitative analysis of glycolysis, glycolytic capacity, and glycolytic reserve of WT and Ampk KO astrocytes (D). Error bars are mean ± SEM. Significance of two-tailed, unpaired t tests is shown. n = 3 biological replicates.
(E–J) Kinetic flux analysis of glycolysis using U13C glucose isotopomer followed by high-performance liquid chromatography (HPLC)/mass spectrometry in WT and Ampk-null astrocytes. Abundance of 13C-labeled metabolites measured after 12-h incubation with U13C glucose. Error bars are mean ± SEM. Significance of two-tailed, unpaired t tests is shown. n = 4 biological replicates.
(K–M) Nissl-stained 1-month-old cortices of control and Ampk lox/lox; Gfap Cre ER mouse (K and L) and quantification of the cortical thickness (M) (n = 5–7 mice/genotype). Scale bars: 50 μm. Error bars are mean ± SEM. Significance of two-tailed, unpaired t tests is shown.
(N–P) IHC of 1-month-old control and Ampk lox/lox; Gfap Cre ER mouse cortices stained with NeuN antibody (green) and DAPI (blue) (N and O), and quantification of NeuN+ cells (P) (n = 4 mice/genotype). Scale bars: 50 μm. Error bars are mean ± SEM. Significance of two-tailed, unpaired t tests is shown.
See also Figures S4 and S5.

