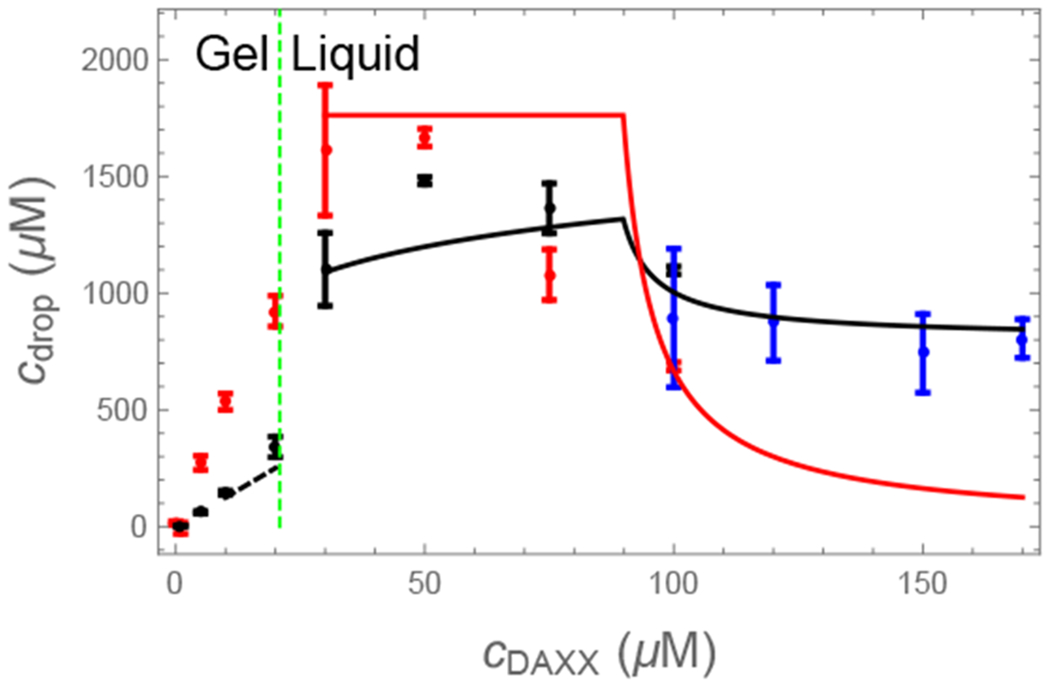
Figure 5:

Experimental23 (points) and computed (lines) protein concentrations in the condensed phases. In the gel phase (left of the dashed line) the SPOP concentration is determined by a kinetic arrest of the network condensation. The cDAXX concentration (black) is given by the binding of cDAXX to this network (Eq. 14). In the liquid phase the SPOP (red) and cDAXX (black) concentrations (Eq. 32 and Eq. 33) are initially given by the excluded volume of the cylindrical SPOP-cDAXX assemblies (plateau region), before relaxing toward the values expected for a pure cDAXX solution (blue points).
