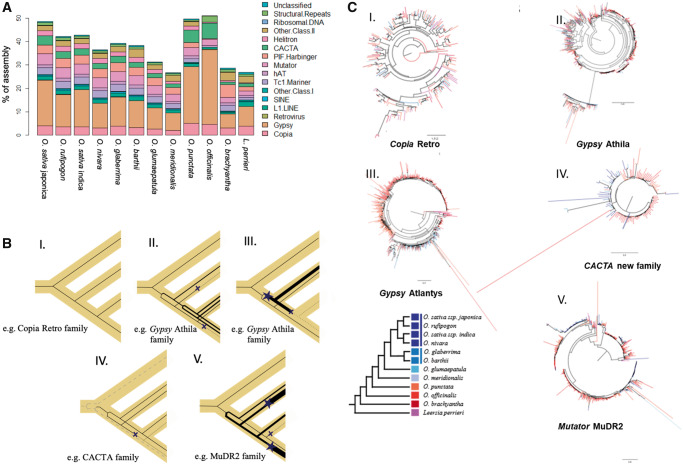
Fig. 3.
—Proportion of different repeat classes in sequenced diploid Oryza genomes and L. perrieri. (A) The repeat annotation was performed consistently across all assemblies and thus highlights actual differences among assemblies. The greater number of repeats reflects the larger genome size of O. officinalis. Copia, Gypsy retroelements, and CACTA DNA-Ts appear to have proliferated much more in the BB and CC genome types compared with other species. (B) Simplified representation of different TE behaviors. TE family gene trees are drawn (black lines) within a representative species tree (yellow shadow), depicting the changes occurring to the type and abundance of TEs for each family. Line thickness is a proxy of TE copy number, finely dashed lines are dead/silenced lineages, and dashed lines represent a distantly related family. Stars indicate TE burst, Xs TE inactivation, or loss. Each bifurcation represents the origination of a different subfamily. Each panel I–V represents the pattern observed in (C, I–V). (C) Examples of TE behavior across multiple closely related species. (I) Subtree of the Copia retro family, (II) subtree of the Gypsy Athila family, (III) subtree of the Gypsy Atlantys family, (IV) subtree of a newly found Cacta family, related to the known Eric and Grover elements, and (V) subtree of the Mutator MuDR2 family.

