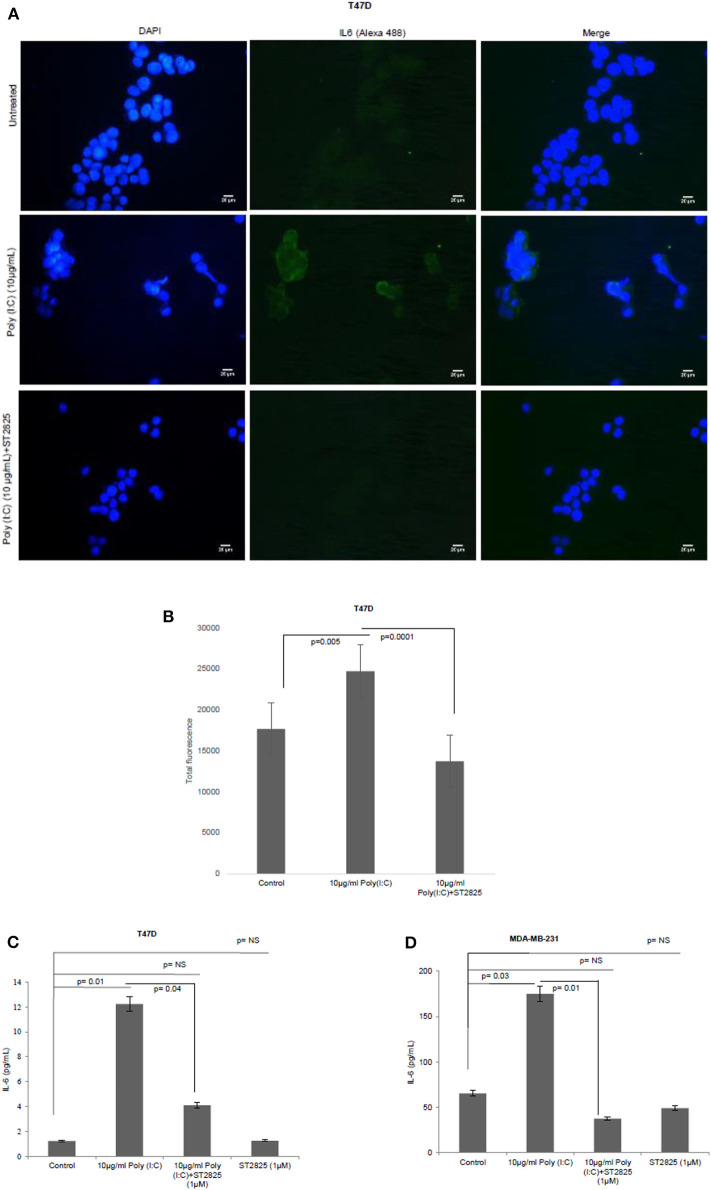
Figure 3.
Expression of IL-6 following MyD88 inhibitor and TLR3 ligand treatment. (A) Fluorescent microscopy image of T47D cells, treated with TLR3 ligand (10 μg/ml) with or without MyD88 inhibitor (1 μM) following immunocytochemical staining with antibody against IL-6 and Alexa 488-tagged secondary antibody and counterstained with DAPI. Untreated indicates the cells are not treated with TLR3 ligand (magnification, 40X). (B) Bar graph showing the expression of IL-6 following observation through a microscope and analyses through the ImageJ software for all the experiment groups. (C,D) Expression of IL-6 in the cell culture supernatant as measured through ELISA. The results are presented as mean ± SD (p < 0.05 is treated as significant).

