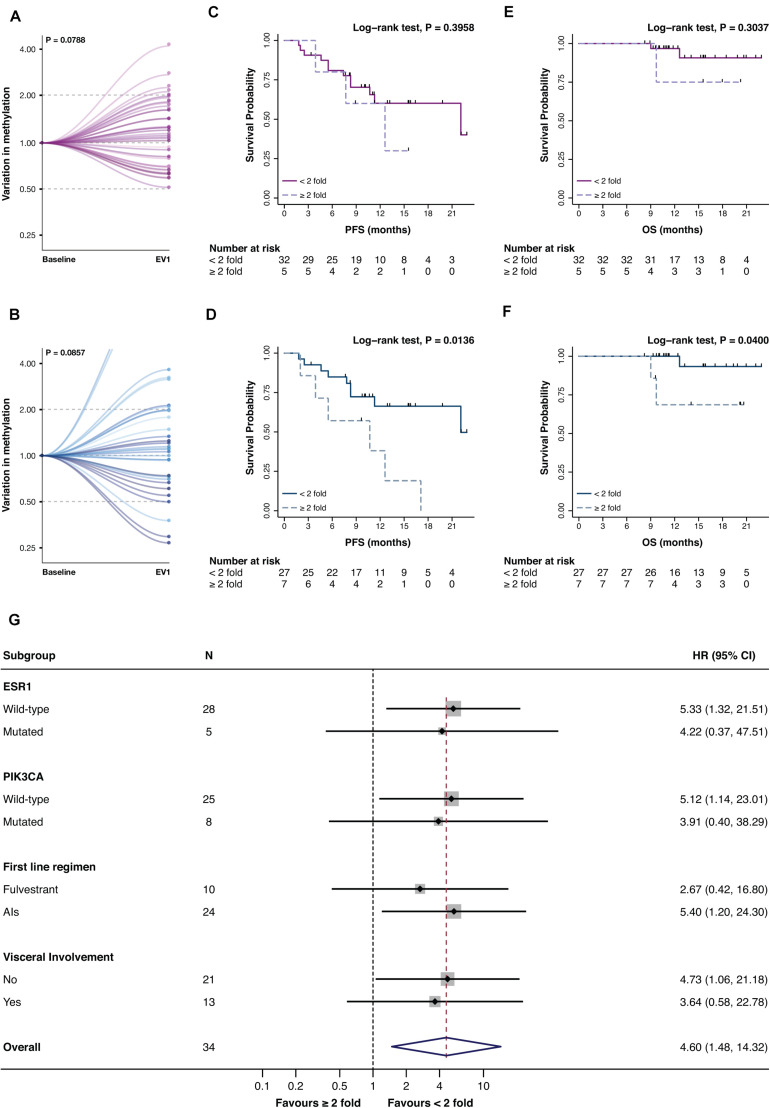
FIGURE 4.
Variation of promA (purple) and promB (blue) between BL and EV1 (A,B) and impact on PFS (C,D) and OS (E,F) of a ≥2-fold increase in promA and promB. Subgroup analysis of the impact on PFS of a ≥2-fold increase in promB (G). A numerical increase in promA was observed after normalization to the baseline levels. For two cases, an 18- and 15-fold increase in promB was observed (B) and were, therefore, out of scale (B). A ≥2-fold increase in promA was not associated with PFS or OS (C,E), while a doubling in promB resulted in a significantly worse prognosis both on PFS and OS (D,F). Notably, subgroup analysis showed a consistent impact on PFS across different ET backbones and according to ESR1 and PIK3CA mutational status.

