
Figure 6.
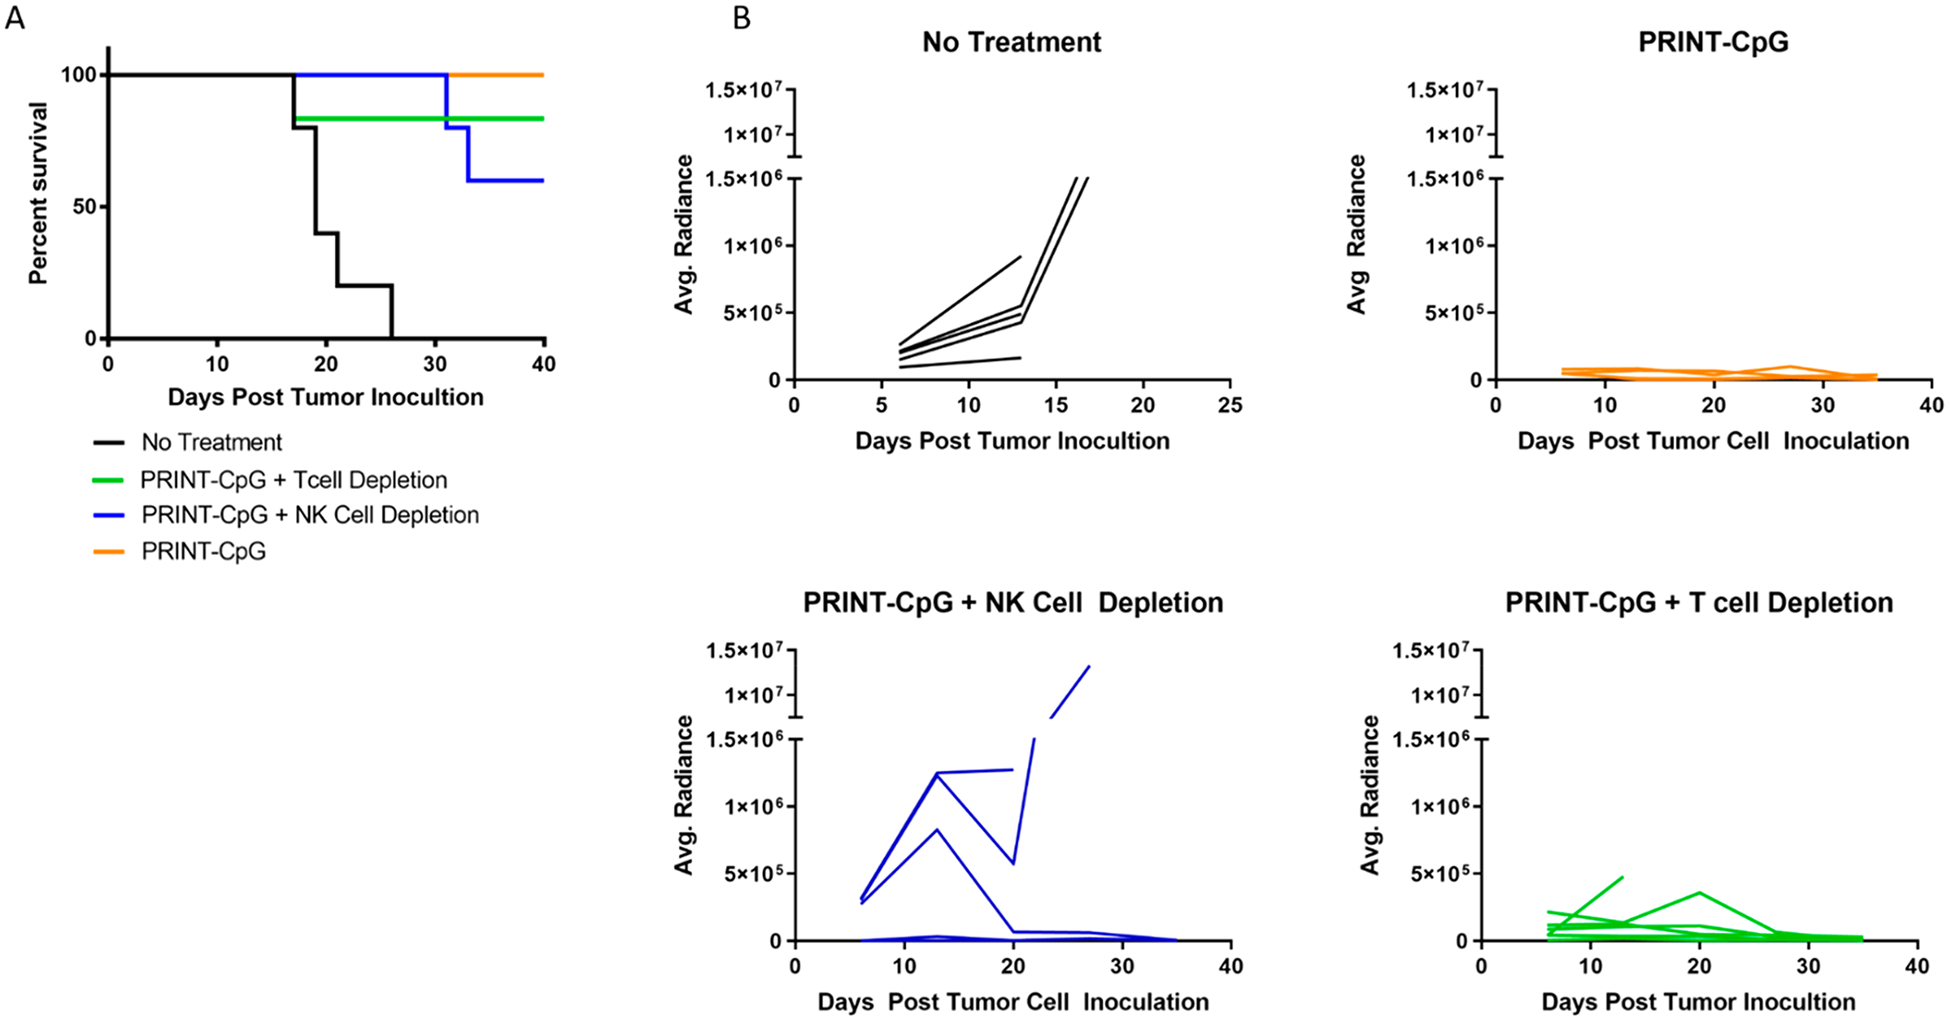
Therapeutic efficacy following depletion of T cells or NK cells. Mouse survival (A) and tumor growth plots as measured from bioluminescence images (B), for mice treated with PRINT-CpG (20 μg), untreated (No Tx), depleted of CD8 T cells and treated with PRINT-CpG (20 μg), and depleted of NK cells and treated with PRINT-CpG (20 μg) (n = 5 mice per treatment group).