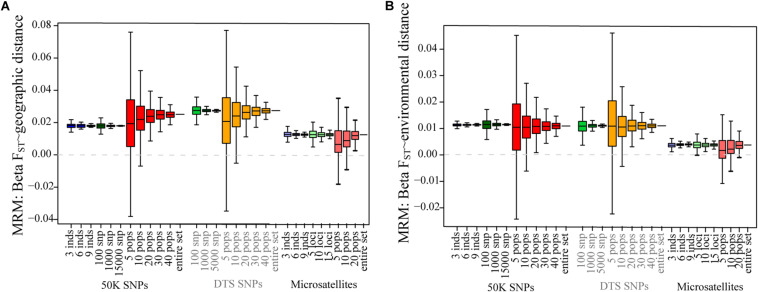
FIGURE 2.
The effect of sampling designs on the analysis of patterns of isolation for genomic and microsatellite datasets: (A) IBD-MRM test; (B) IBE-MRM test. Boxplots show the distribution of associations estimated for 1,000 simulations varying the number of individuals, number of SNPs, and number of sampled populations. The dotted gray line shows the 0 value.

