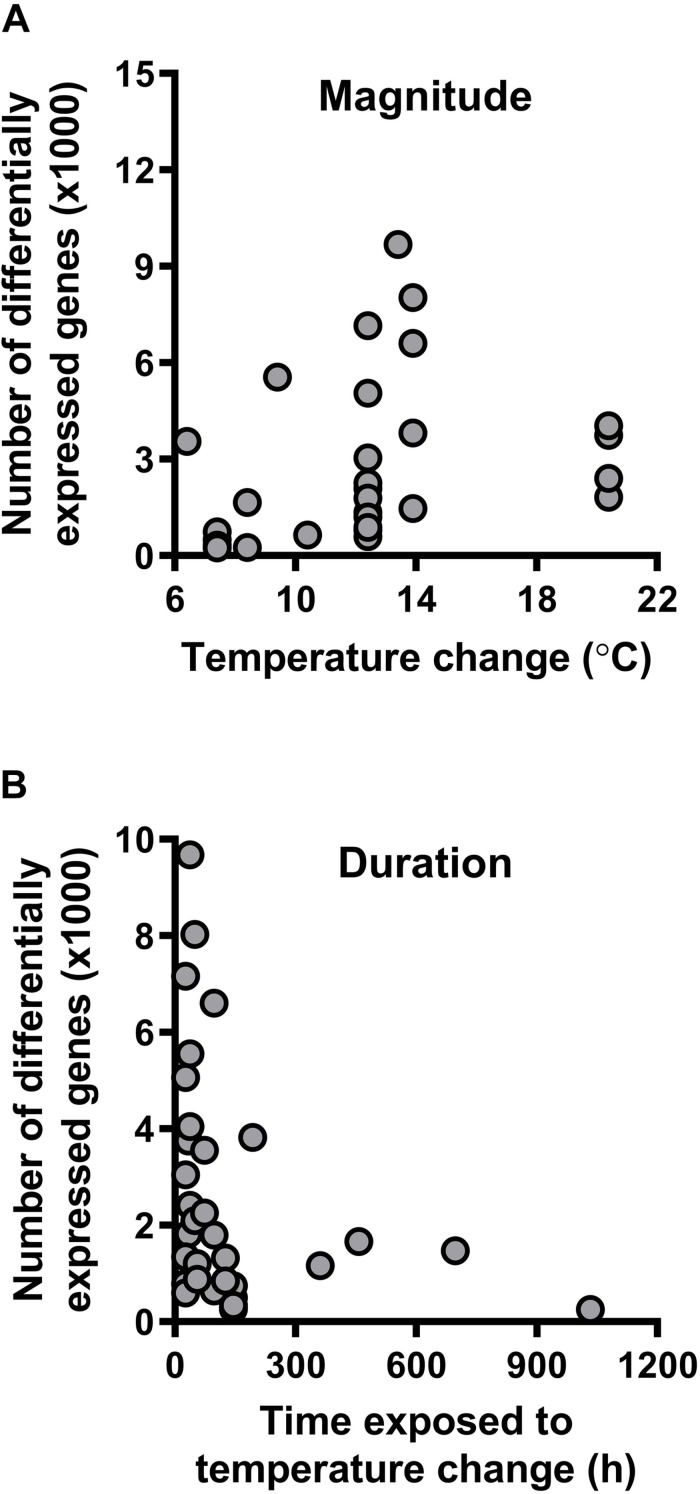
FIGURE 3.
Transcriptomic responses to temperature change. (A) The number of differentially expressed genes increases with the magnitude of temperature change to which an organism is exposed. (B) The number of differentially expressed genes does not vary with duration of exposure to a given magnitude of temperature change. See Table 1 for the list of studies from which we extracted the values included in this figure.

