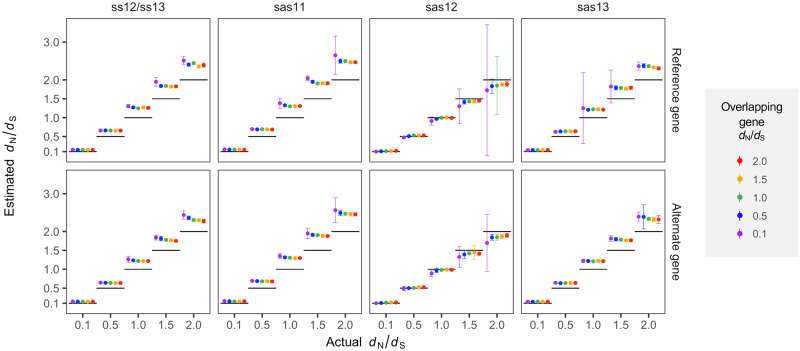
Fig. 2.
Assessment of OLGenie using simulated sequences. Calibration plots show the accuracy and precision of OLGenie dN/dS estimates for the reference (top row; dNN/dSN) and alternate (bottom row; dNN/dNS) genes when mean pairwise distance is set to 0.0585 per site (median of biological controls). For each frame relationship, estimated dN/dS is shown as a function of the actual simulated value, indicated by horizontal black line segments (x axis values), and of the dN/dS value of the overlapping gene, indicated by color (left to right: purple = 0.1; blue = 0.5; green = 1.0; orange = 1.5; and red = 2.0). For example, all purple points in the top row refer to simulations with alternate gene dN/dS = 0.1, whereas all purple points in the bottom row refer to simulations with reference gene dN/dS = 0.1. To obtain highly accurate point estimates, each parameter combination (reference dN/dS, alternate dN/dS, frame) was simulated using 1,024 sequences of 100,000 codons (supplementary table S1, Supplementary Material online). Then, to obtain practical estimates of variance relevant to real OLG data, simulations were again carried out for each parameter combination so as to emulate our biological control data set: a sample size of 234, with sequence lengths (number of codons) and numbers of alleles (max 1,024) randomly sampled with replacement from the controls (supplementary table S2, Supplementary Material online). Error bars show SEM, estimated from replicates with defined dN/dS values (≤234) using 10,000 bootstrap replicates (reference codon unit). A transition/transversion ratio (R) of 0.5 (equal rates) was used; similar results are obtained using R = 2 (supplementary fig. S3, Supplementary Material online). Full simulation results are presented in supplementary tables S1–S6 and figures S1–S6, Supplementary Material online.

