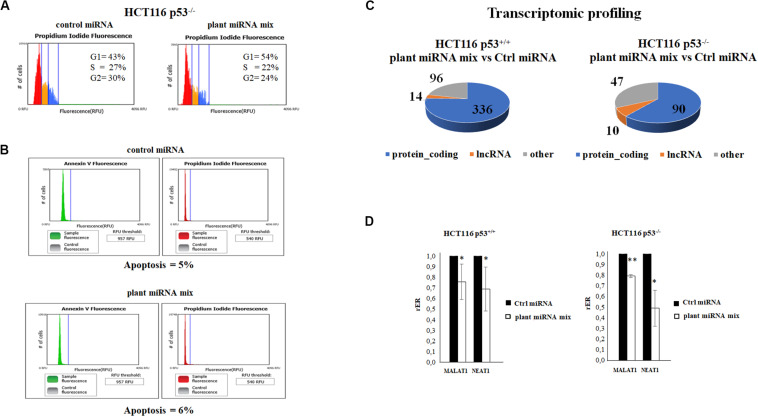
FIGURE 3.
Plant microRNAs (miRNAs) induce the arrest of the cells in G1 and modulate the transcriptomic profile. (A) Cell cycle analysis of HCT116p53–/– transfected for 48 h with control miRNA or with a mix of the seven selected plant miRNAs (15 μM f.c. for each; gma-miR-160, gma-miR-4995, gma-miR-4368, gma-miR-5677, gma-miR-4351, zma-miR-172, and mtr-miR-5754). (B) The apoptosis of HCT116 p53–/– cell transfected with plant miRNA mix (15 μM f.c. for each plant miRNA) or with the control miRNA was analyzed using Tali® Apoptosis Kit–Annexin V Alexa Fluor® 488 and propidium iodide. (C) The pie charts show the proportions of transcript types for statistically significant differentially expressed genes in HCT116 p53+/+ and HCT116 p53–/– from RNA-Seq data analysis: protein coding, long non-coding RNAs (lncRNAs), others. (D) Reverse transcription quantitative PCR (RT-qPCR) of metastasis-associated lung adenocarcinoma transcript 1 (MALAT1) and nuclear paraspeckle assembly transcript 1 (NEAT1) lncRNAs in HCT116 p53+/+ and HCT116 p53–/– cell lines transfected for 72 h with control miRNA or with a mix of the seven selected plant miRNAs (gma-miR-160, gma-miR-4995, gma-miR-4368, gma-miR-5677, gma-miR-4351, zma-miR-172, and mtr-miR-5754). Data are shown as the average with a standard deviation of three independent experiments (*p < 0.05 and **p < 0.005).

