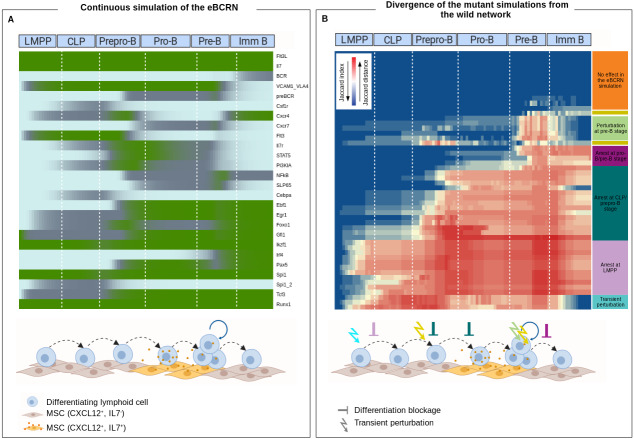
Figure 3. Wild-type and mutant eBCR networks simulated as continuous models.
(A) Simulation of the wild-type network. The heatmap shows the activation value for each node of the eBCRN simulated for 100 time-steps. The illustration represents cell transitions in the BM inferred by the activation of microenvironment communication molecules modulated during the continuous simulation. (B) Mutant effects on the early B cell differentiation. The heatmap shows the distance per time-step (columns) calculated using Jaccard index, between each mutant (rows) and the wild-type network. The mutant simulations cluster depends on the developmental stage where simulation diverge from the wild-type network. The developmental stages that are affected by each cluster are depicted.

