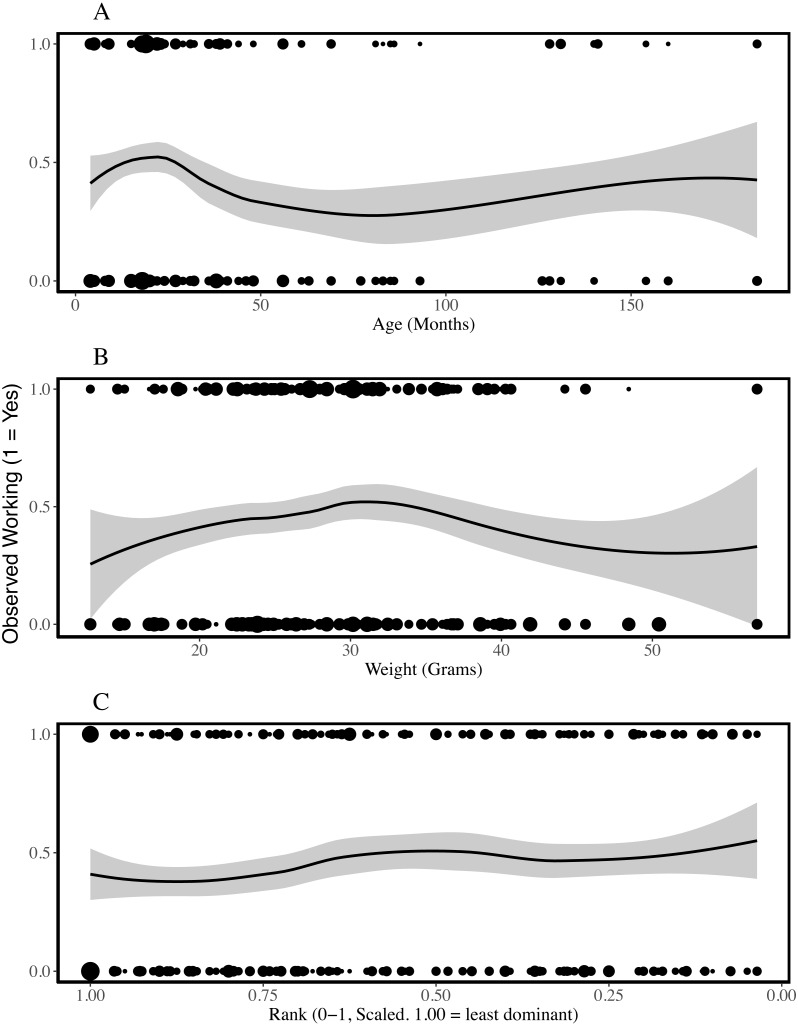
Figure 1. Presence of working behaviour by age (A), weight (B) and rank (C) of the individual being observed.
The plots are fitted with locally weighted (loess) regression lines that display localised trends in the data. These are different from the models described below which include colony and individual as random effects. The size of the points reflects the number of data points at each location (geom_count, ggplot2). Rank is scaled to account for group size and the most dominant individuals have ranks closer to zero. Age and weight-cubed were associated with the probability that an individual was observed working; younger and mid-sized individuals worked most frequently.

