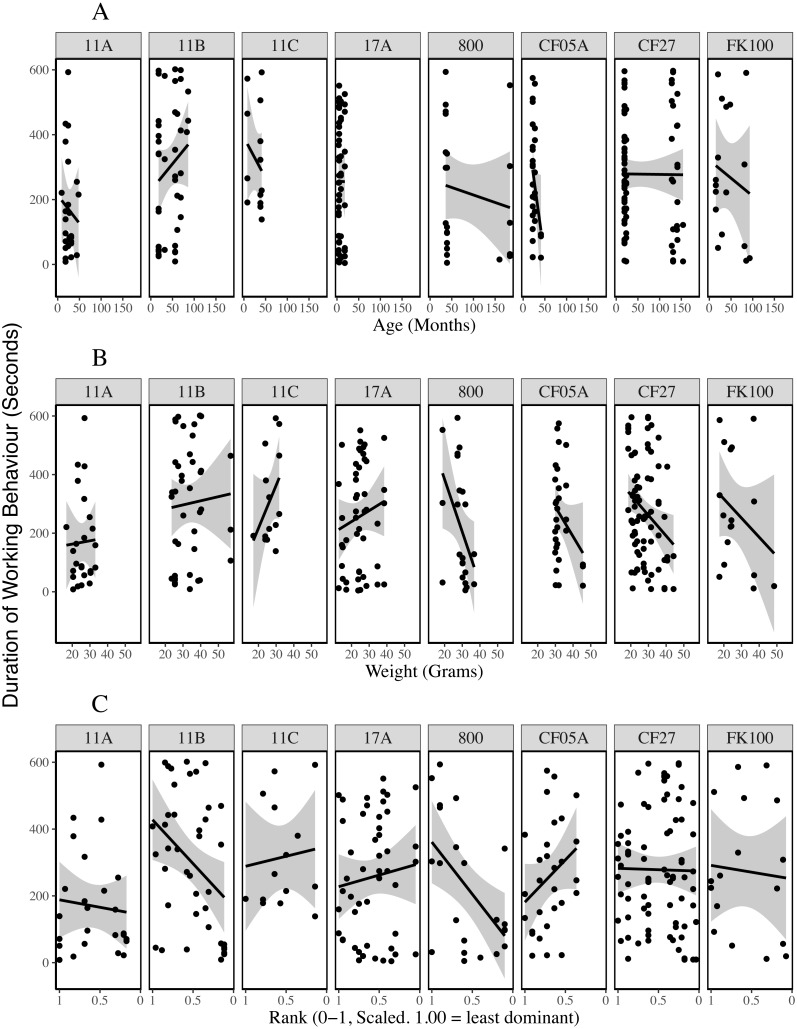
Figure 5. Duration of working behaviour by age (A), weight (B) and rank (C) of the individual being observed for each colony.
The lines are general linear regressions with duration of working behaviour as the response variable using ggplot2’s stat_smooth function (Wickham, 2016).

