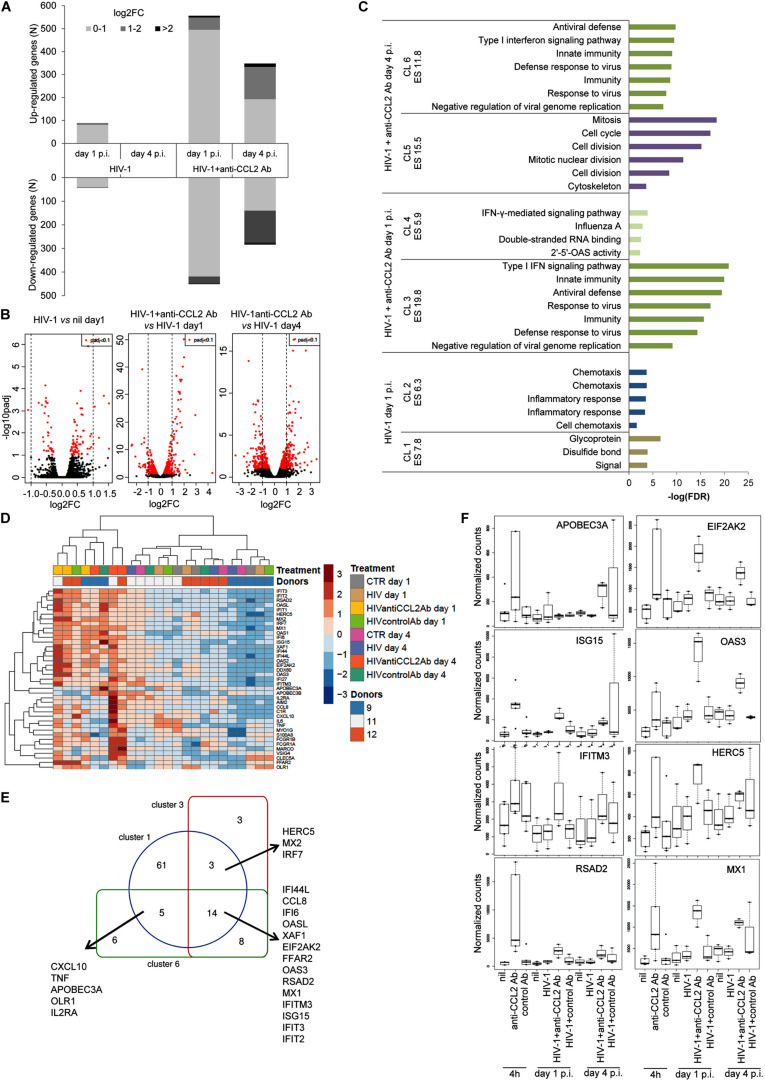
FIGURE 4.
Effect of CCL2 neutralization on the HIV-1–infected MDM transcriptome. MDMs obtained from three donors were treated or not with anti-CCL2 or control Ab (2.5 μg/mL) for 4 h and then infected with HIV-1BaL. Total RNA was extracted at days 1 and 4 p.i., subjected to poly(A) selection followed by reverse transcription, generation of cDNA libraries, and sequencing (dataset 3). (A) Number of differentially expressed genes in HIV-1–infected MDMs exposed or not to anti-CCL2 Ab. (B) Volcano plot representations showing significances versus fold changes of differential expression analysis of genes in the HIV-1 day 1 versus nil day 1, HIV-1 + anti-CCL2 Ab day 1 versus HIV-1 day 1 and HIV-1 + anti-CCL2 Ab day 4 versus HIV-1 day 4 comparisons. The red points mark the significantly differentially expressed genes (padj < 0.1), and the vertical lines indicate the twofold change threshold. (C) Functional annotation clustering by DAVID of the genes up-regulated in HIV-1–infected MDMs exposed or not to anti-CCL2 Ab at days 1 and 4 p.i. For the HIV-1 + anti-CCL2 Ab condition, the graph reports the two clusters with the highest significance. (D) Heatmap with unsupervised hierarchical clustering of the 39 genes included in clusters 3 and 6. (E) Venn diagram showing the overlay of genes included in cluster 3 (HIV-1 + anti-CCL2 Ab day 1 p.i.), cluster 6 (HIV-1 + anti-CCL2 Ab day 4 p.i.), and cluster 1 of Figure 2A (anti-CCL2 Ab 4 h). (F) Box plots of DESeq2 normalized counts of APOBEC3A, EIF2AK2, OAS3, HERC5, IFITM3, ISG15, MX1, and RSAD2 transcripts in uninfected MDMs following 4-h exposure to anti-CCL2 Ab (datasets 1 and 2) and HIV-1–infected MDMs following exposure to anti-CCL2 Ab at days 1 and 4 p.i. (dataset 3). Each condition has three and five biological replicates for HIV-1–infected and uninfected MDMs, respectively.

