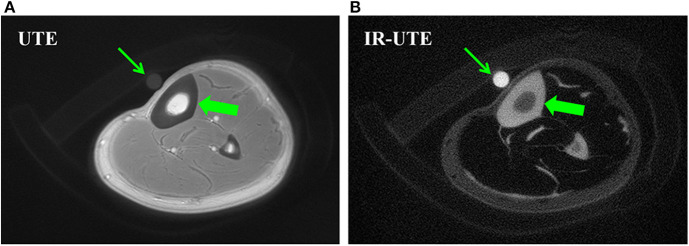
Figure 1.
Bone water concentration was estimated by comparison of signal intensity of bone (thick arrows) relative to that of a water calibration phantom (thin arrows) using UTE (A) and IR-UTE (B) sequences, providing a bone water concentration estimation of 22.2 ± 2.7% and 16.8 ± 1.9%, respectively. This figure was previously presented by Du et al. (38). Reprinting permission is granted through Rightslink system. This figure is modified for presentation purposes. Minor modifications were performed for presentation purposes.

