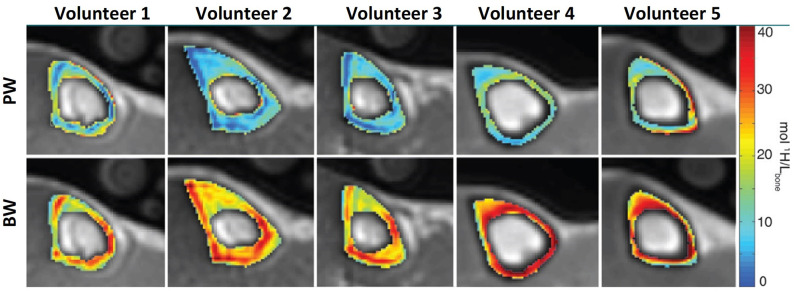
Figure 3.
PW (top row) and BW (bottom row) proton density maps of tibial midshaft in five different subjects (two men and three women aged 24, 24, 49, 30, and 26 years). Maps are overlaid on UTE MRI images. This figure was previously presented by Manhard et al. (41). Reprinting permission is granted from Radiology journal (RSNA). This figure is modified for presentation purposes. Minor modifications were performed for presentation purposes.

