Figure 4.
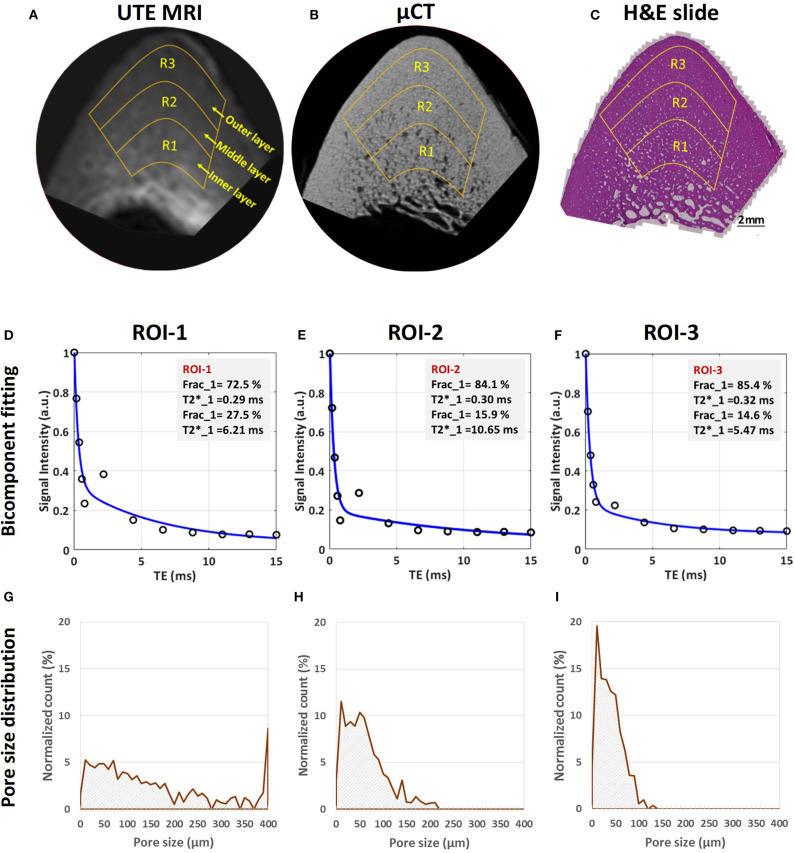
MRI-based and histomorphometric analyses for three representative ROIs at three different cortical bone layers. Selected ROIs at three different bone layers on a representative bone specimen (male, 71-year-old) illustrated on (A) UTE MRI (TE = 32 μs, 250 μm pixel size), (B) μCT (9 μm pixel size) and (C) histology (H&E-stained, 0.2 μm pixel size) images. Bicomponent exponential fitting of the T2* decay within (D) ROI-1, (E) ROI-2, and (F) ROI-3. The oscillating actual data points indicate the presence of fat particularly in ROI-1 and ROI-2 near the endosteum. Pore size distribution obtained from histomorphometric analyses are shown for (G) ROI-1, (H) ROI-2, and (I) ROI-3. Histomorphometric porosity and pore size for ROI-1 to−3 are 33.1, 13.9 and 7.1% and 221, 83 and 49 μm, respectively. The μCT-based porosities are 21.2, 8.2, and 1.7% for ROIs-1 to−3, respectively. This figure was previously presented by Jerban et al. (51). Reprinting permission is granted through Rightslink system. This figure is modified for presentation purposes. Minor modifications were performed for presentation purposes.

