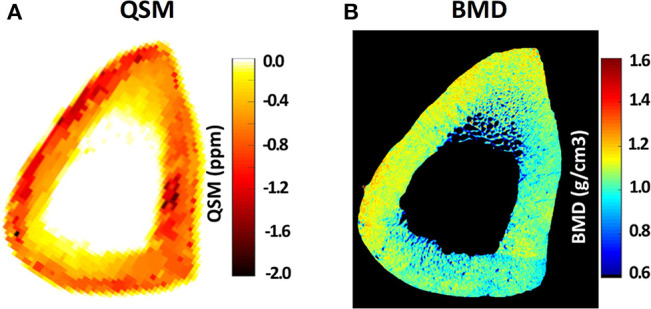
Figure 9.

(A) Quantitative susceptibility map (QSM) using Cones 3D UTE MRI scans (0.5 × 0.5 × 2 mm voxel size) of a representative tibial midshaft cortical bone (45-year-old female), (B) μCT-based volumetric bone mineral density (BMD) map of the same specimen. Local maxima in the QSM map clearly correspond to the regions of high BMD in μCT-based maps. This figure was previously presented by Jerban et al. (64). Reprinting permission is granted through Rightslink system. This figure is modified for presentation purposes. Minor modifications were performed for presentation purposes.
