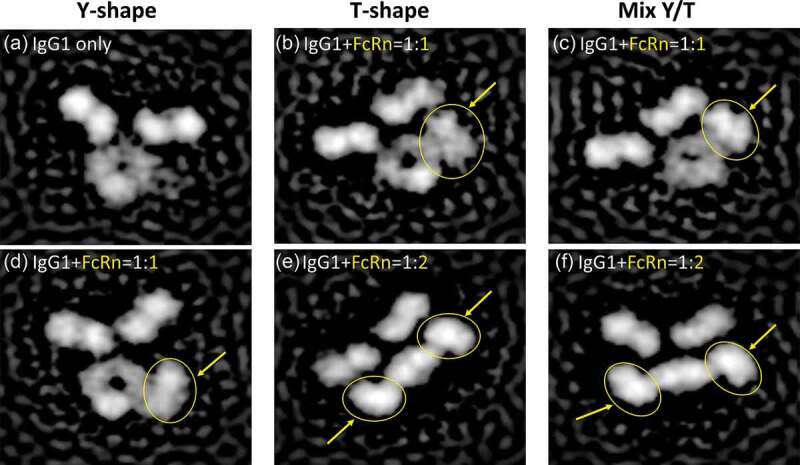
Figure 2.

Visualization of IgG1-FcRn complex by negative stain electron microscopy. Six representative classifications of IgG1 and IgG1-FcRn complex are shown. FcRn is highlighted with yellow arrows/circles. (a) IgG1 alone in a canonical Y-shaped conformation. (b) IgG1 in a T-shaped conformation and binds to FcRn at 1:1 stoichiometry. (c) IgG1 in a Y/T mixed conformation and binds to FcRn at 1:1 stoichiometry. (d) IgG1 in a canonical Y-shaped conformation and binds to FcRn at 1:1 stoichiometry. (e) IgG1 in a T-shaped conformation and binds to FcRn at 1:2 stoichiometry. (f) IgG1 in a Y/T mixed conformation and binds to FcRn at 1:2 stoichiometry.
