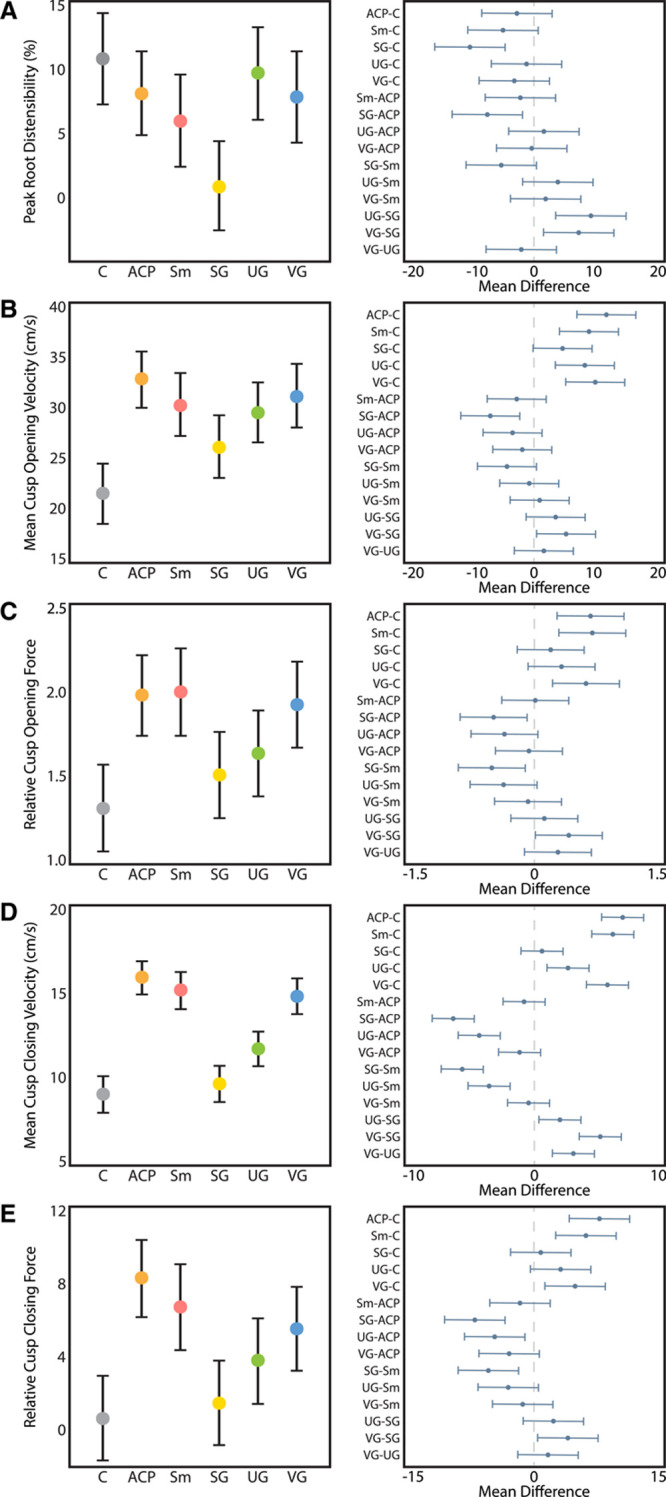
Figure 6.

Videometric parameters. A, Peak aortic root distensibility trended lower in the grafts vs the control but was only statistically significantly lower in the straight graft group (Tukey adjusted P≤0.01), with the straight graft being significantly lower than all grafts (P≤0.01 for each) with the exception of Stanford modification (Sm). B, All grafts except straight graft (SG) had significantly higher mean cusp opening velocity than native aortic root controls (P<0.01 for each). C, Relative cusp opening forces were similar between the SG, Uni-Graft (UG), and control (C) groups, whereas the anticommissural plication (ACP), Sm, and Valsalva graft (VG) groups had significantly higher relative cusp opening forces (P≤0.01 for each). The SG group experienced significantly lower relative opening forces than the ACP, Sm, and VG groups (Tukey adjusted P=0.01, 0.01, and 0.03, respectively). D, Closing velocity was significantly higher than in the native root in all grafts except for the SG group (P<0.01 for each). The SG group had significantly lower closing velocities vs any other conduit (P≤0.01 for each comparison). The UG group had significantly lower closing velocities than the ACP, Sm, and VG groups (P≤0.01 for each). E, Only the SG and UG groups experienced relative closing forces approaching that of the native root, whereas relative forces were >5-fold higher in the ACP, Sm, UG, and VG groups (P≤0.01 for each). Left panels report model-adjusted means with 95% CIs, and right panels display Tukey-adjusted pairwise differences in means with 95% CIs. Reported P values are adjusted for multiple comparisons with Tukey correction.
