Figure 1.

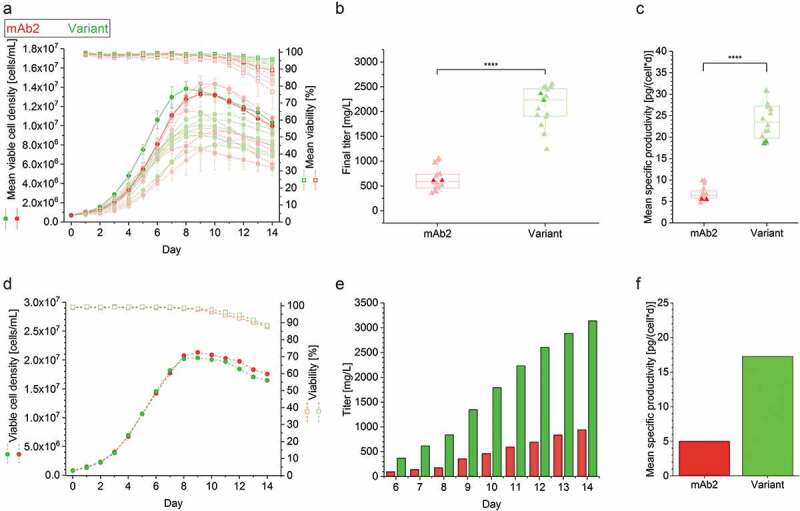
Cell culture performance of clonal cell lines producing either the mAb2 or its in silico optimized variant in controlled fed-batch production processes. (a) Viable cell density (VCD, filled circles) and viability (open square), and (b) final antibody titer and (c) mean specific productivity (filled triangle) of the top eight clonal cell lines are shown for a controlled 14-day micro-bioreactor fed-batch cultivation process (ambrTM 15). In case of VCD and viability the mean and standard deviation of biological duplicates (n = 2) are displayed. Each replicate was used as single data point in the boxplot, and whiskers represent the 10th and the 90th percentile. The highlighted clones (thicker line and more intense color) were further investigated in 3 L benchtop bioreactors. An unpaired t-test confirmed statistical significance (****: p < .0001). (d) VCD (filled circles) and viability (open square), (e) cumulative antibody titer, and (f) calculated mean specific productivity of the best performing clonal cell lines in a controlled 14-day fed-batch cultivation process was performed in 3L bioreactors. The runs were performed without biological replicates, and antibody titer was determined starting from day 6. Clonal stability data can be found in Supplementary Figure S1.
