
Figure 3.
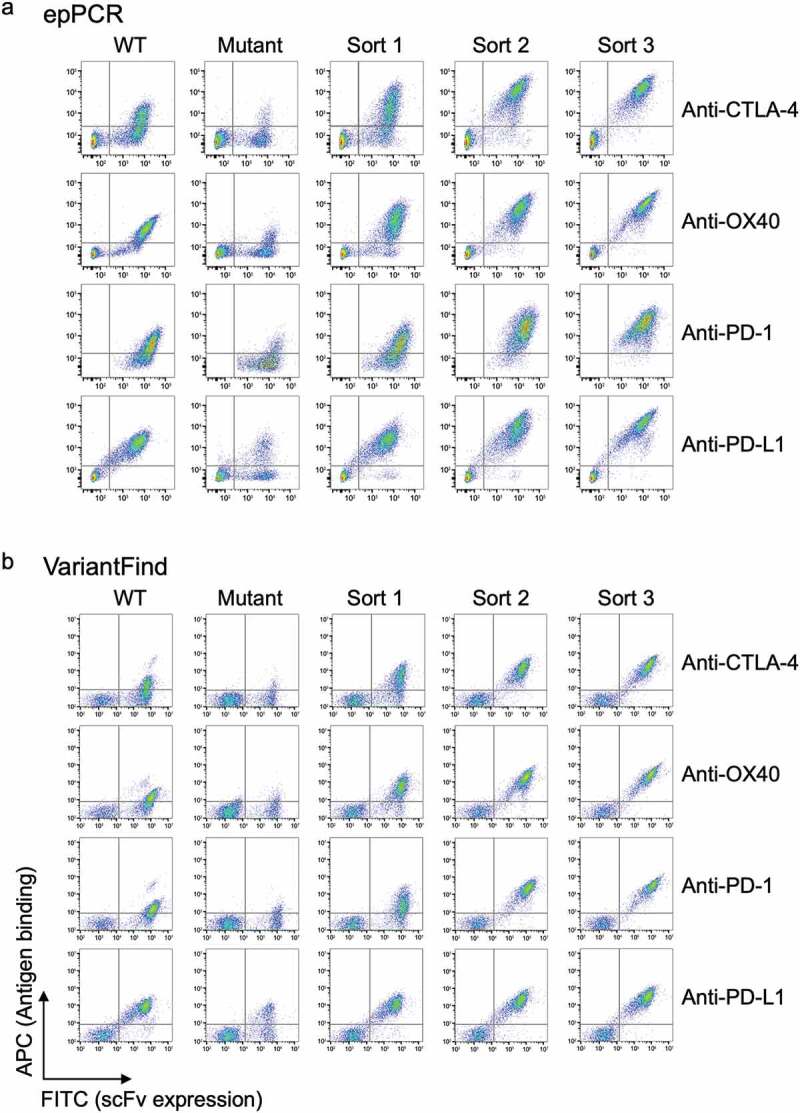
Flow cytometry profiles for parental scFv yeast clones, epPCR, or VariantFind mutagenized libraries, and post-sort libraries. (a) EpPCR mutagenized samples. (b) VariantFind mutagenized samples. Each row from left to right represents the following samples: parental strain, unsorted mutagenized library, and one, two, or three times sorted libraries, all stained with the relevant soluble antigen. The y-axis reflects antigen binding, whereas the x-axis displays scFv expression through staining of the c-myc tag.