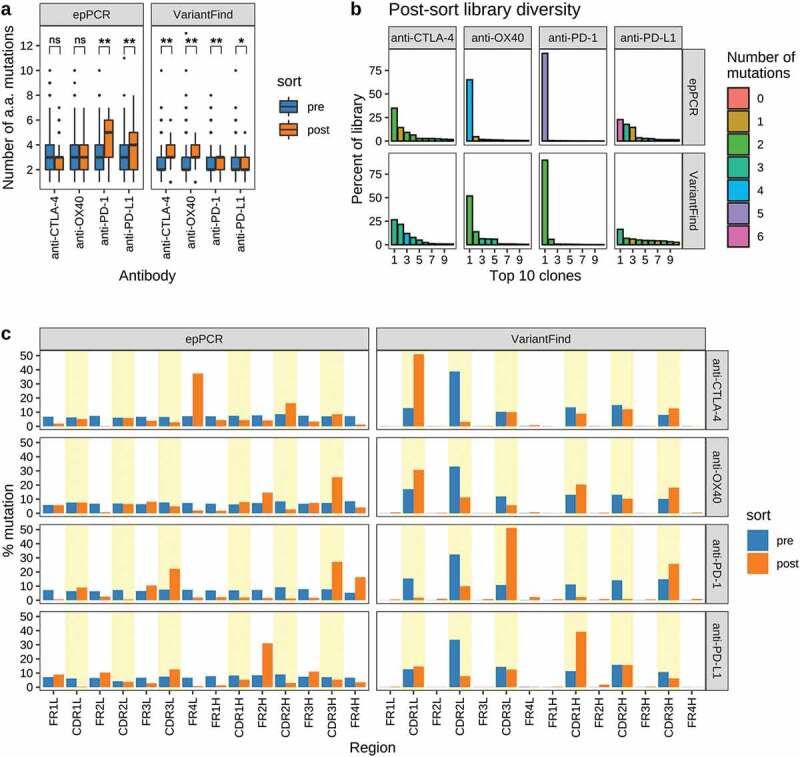
Figure 4.

Sequence characteristics the mutagenized libraries after FACS sorting. (a) Boxplots showing the number of amino acid mutations in each library relative to the parental antibody sequences. Pre- and post-sort libraries are shown in blue and orange, respectively. P-values were determined using Wilcoxon rank sum test (**p < .0001, *p < .05, ns = not significant). (b) Library diversity post-FACS enrichment. The panels represent the 8 mutagenized libraries (top = epPCR, bottom = VariantFind). The x-axis shows the top 10 clones ranked by abundance, while the y-axis shows their percent abundance, as measured by percent sequencing reads, in the respective libraries. The bars are color-coded to indicate the number of amino acid mutations in the clones. (c) Distribution of mutations in different antibody regions (FR = framework region, CDR = complementarity-determining region) on the light (l) and heavy (h) chains. The y-axis represents percent mutation, normalized by the number of amino acids in a given region, relative to the total number of mutations in the library. The blue and orange bars represent pre- and post-sort libraries, respectively. CDR regions are shaded in yellow.
